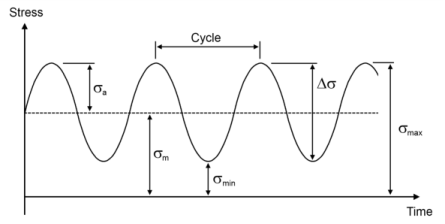
The most common fatigue test is where the loading is fully reversed. The mean stress is then zero and R =
−1. The second fundamental test is the pulsating test, where the load varies between zero and a maximum value, giving
R =
0.
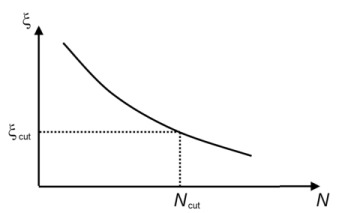
One of the simplest methods for fatigue evaluation is a relation between a fatigue controlling quantity, ξ, and the fatigue life,
N, see
Figure 3-4. This relation is the fatigue life curve. In most applications the fatigue controlling quantity is a stress amplitude or a strain amplitude.
In COMSOL the fatigue life curve is used in the following models: Stress-Life Models,
Strain-Life Models,
Strain-Based Fatigue Models,
Cumulative Damage Model, and
Vibration Fatigue Model. The fatigue life curve goes asymptotically toward infinite life for low values of the fatigue controlling quantity. The objective of a fatigue analysis is to find the critical life that is found for the largest value of the fatigue controlling quantity. Since the spread in the results can be very large, a cycle cutoff,
Ncut, controls how far on the life curve results are evaluated. When the fatigue controlling quantity is low,
ξ < ξcut, the fatigue life is set to the cycle cutoff,
N = Ncut.