PDF

Low Temperature PEM Fuel Cell with Serpentine Flow Field
Introduction
Water management is crucial for low-temperature polymer electrolyte fuel cell (PEMFC) operation. Water is produced on the air (cathode) side in the oxygen reduction reaction, but may permeate through the membrane to the hydrogen (anode side). Running the cell under too wet conditions may result in mass transport limitations of gases due to flooding of liquid water in the pores, whereas running the cell under too dry conditions may result in poor performance due to a low ohmic conductivity in the ionomer (polymer electrolyte) used in the membrane and catalytic layers.
This tutorial explores the current distribution in a low temperature PEMFC when using serpentine flow field patterns, in combination with operating the cell in counter-flow mode so that the oxygen and hydrogen inlet flow streams are located at opposite sides (in the in-plane direction of the membrane) of the cell. Relatively dry inlet gas compositions are used so that the cell relies on self-humidification for achieving good performance.
For a more detailed analysis and discussion of the local transport phenomena of the fuel cell membrane-electrode assembly (MEA), see also the Transport Phenomena in a Polymer Electrolyte Fuel Cell Membrane-Electrode Assembly tutorial.
Model Definition
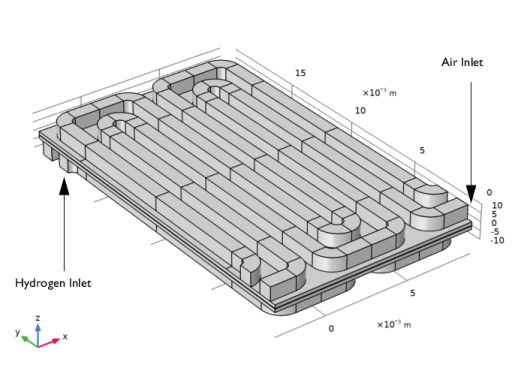
Figure 1 shows the model geometry. The MEA is sandwiched between the anode and cathode gas diffusion layers, and the flow field channels, with the location of the gas stream inlets as indicated in the figure.
Figure 1: Model geometry. The fuel cell MEA is sandwiched between two gas diffusion layers, and the hydrogen and oxygen serpentine flow channels. The air side is located above the MEA, the hydrogen side is located below the MEA. The gas inlet positions are indicated in the figure.
The model solves for the charge balance (the electrode and electrolyte phase potentials) in the gas diffusion layers and the membrane, as well as the mass transfer (the molar fractions) and momentum transport (pressure and velocity) in the gas phase on each side of the membrane. The membrane transport of water, due to both diffusion (permeation) and migration (electroosmotic drag) is also included in the model.
The cell temperature is 70°C, with the relative humidities or the hydrogen and air inlet streams humidified to 25 and 75%, respectively. The molar flow rates of hydrogen and oxygen are set to be proportional to the total current, with a 20% excess of hydrogen and a 150% excess of oxygen (that is, using a hydrogen and oxygen flow stoichiometry of 1.2 and 2.5, respectively).
The model is defined using the Hydrogen Fuel Cell interface and solved using an Auxiliary sweep, ramping up the average cell current density from 0.01 to 1 A/cm2. See the Notes About the COMSOL Implementation and the Modeling Instructions below, and the Transport Phenomena in a Polymer Electrolyte Fuel Cell Membrane-Electrode Assembly tutorial for more details on the model setup.
Results and Discussion
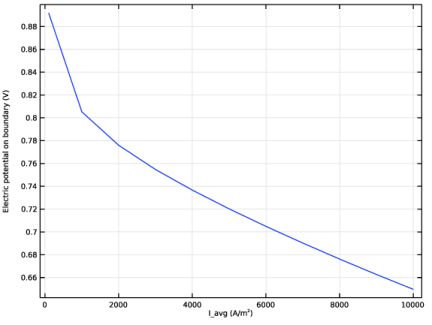
Figure 2 shows the cell polarization curve.
Figure 2: Polarization plot.
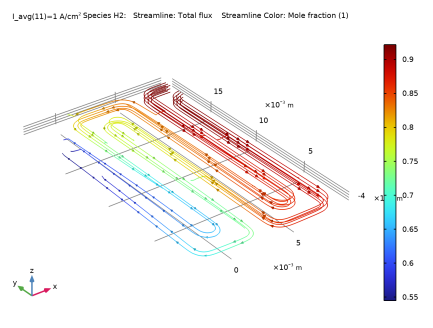
Figure 3 and Figure 4 show the streamlines of hydrogen and oxygen, and the corresponding molar fractions for current density of 1 A/cm2. The molar fractions decrease toward the outlets.
Figure 3: Hydrogen total flux streamlines and molar fraction.
Figure 4: Oxygen total flux streamlines and molar fractions.
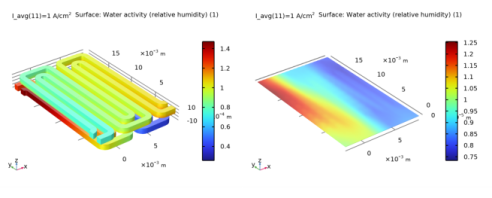
Figure 5 shows the water activity (which equals the relative humidity in the gas phase) in the channels and in the membrane at 1 A/cm2. For both gas streams, the water activity increases toward the outlet. On the oxygen side the increased water activity is a direct effect of the water being produced in the cell. On the hydrogen side, the water activity increase is related mainly to the depletion of hydrogen, that is, the water fraction (at 25% relative humidity at the inlet) of the gas stream increases as hydrogen is consumed, but also to water membrane transport between the two gas compartments.
Figure 5: Left: Relative humidity in the channels. Right: Water activity in the membrane.
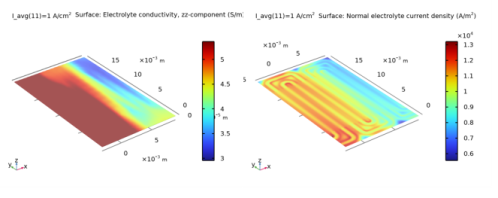
Figure 6 shows the electrolyte conductivity of and the electrolyte current density in the z direction in the membrane. The conductivity depends on the water activity, which has an effect on the current density distribution in the cell, with generally lower current densities in the low conductivity regions. However, the current density distribution also relates strongly to the oxygen levels, lowering the current densities in areas less accessible to oxygen.
Figure 6: Left: Electrolyte conductivity in the membrane. Right: Electrolyte current density in the z direction.
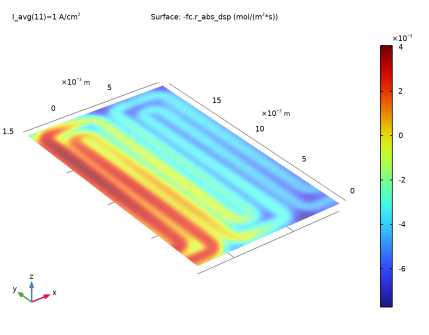
Finally, Figure 7 shows the membrane water flux in the z direction. Close to the oxygen inlet/hydrogen outlet, where the hydrogen side is more humidified than the oxygen side, the flux is positive, indicating that water is transported from the hydrogen to the oxygen side. Close to the oxygen inlet/hydrogen outlet, the water is transported in the negative z direction through the membrane.
Figure 7: Water flux in the z direction of the membrane.
Notes About the COMSOL Implementation
The geometry is defined using an Assembly in the final Union node of the geometry sequence. This creates a geometry consisting of two parts, with a common boundary pair in the middle of the membrane. In this way, non-matching meshes may be used on each side of the membrane. An automatically defined Identity Pair and a Continuity boundary node set up the needed boundary condition at the boundary pair between the assembly parts.
The gas diffusion electrodes of the MEA are not included explicitly in the geometry, and are instead defined as Thin Gas Diffusion Electrodes boundary nodes when defining the physics. This saves memory since the gas diffusion electrodes need not to be meshed.
The gas diffusion layers use anisotropic electronic conductivities, featuring about an order of magnitude higher conductivities in the in-plane (x and y) directions compared to the through-plane (z) direction).
To save computational time, Darcy’s law is used to solve for the flow in both the flow channels as well as in the gas diffusion layers. In the channels, considering the constant rectangular cross section, the permeability was derived based on an expression by Boussinesq (Ref. 1) originally derived for straight channels. See the Solid Oxide Electrolyzer tutorial for how define the flow using the Navier–Stokes and Brinkman equations instead.
The study sequence is set up in three steps: The first step solves for the potential variables for the initial gas composition, the second step solves for velocity distribution by computing the pressure variables, the third step solves the full problem, ramping up the current using an Auxiliary sweep.
The default Direct solver is disabled by enabling an iterative multigrid solver in study step 3. This reduces the memory required for solving the model.
The geometry is fully parameterized. In the modeling instructions a smaller version of the geometry is solved for first before solving for the full geometry.
Reference
1. J. Boussinesq, “Mémoire sur l'influence des Frottements dans les Mouvements Réguliers des Fluids,” J. Math. Pures Appl., vol. 13, no. 2, pp. 377–424, 1868.
Application Library path: Fuel_Cell_and_Electrolyzer_Module/Fuel_Cells/pemfc_serpentine_flow_field
Modeling Instructions
From the File menu, choose New.
New
In the New window, click  Model Wizard.
Model Wizard
1
In the Model Wizard window, click  3D.
2
In the Select Physics tree, select Electrochemistry>Hydrogen Fuel Cells>Proton Exchange (fc).
3
Click Add.
4
Click  Study.
5
In the Select Study tree, select Preset Studies for Selected Physics Interfaces>Stationary with Initialization.
6
Geometry 1
1
In the Geometry toolbar, click Insert Sequence and choose Insert Sequence.
2
3
In the Geometry toolbar, click  Build All.
Global Definitions
Geometry Parameters
The geometry is fully parameterized. Create a smaller version of the geometry to use while setting up the physics.
1
In the Model Builder window, under Global Definitions click Parameters 1.
2
In the Settings window for Parameters, type Geometry Parameters in the Label text field.
3
Locate the Parameters section. In the table, enter the following settings:
Geometry 1
1
In the Geometry toolbar, click  Build All.
2
In the Model Builder window, collapse the Geometry 1 node.
3
Click the  Zoom Extents button in the Graphics toolbar.
Global Definitions
Physics Parameters
1
In the Home toolbar, click  Parameters and choose Add>Parameters.
2
In the Settings window for Parameters, type Physics Parameters in the Label text field.
3
Locate the Parameters section. Click  Load from File.
4
Change the hydrogen stoichiometry (inlet flow rate) and inlet relative humidity. This will make it easier to solve for the smaller geometry. You will go back and revert these changes later before solving for the full model.
5
Add Material
1
In the Home toolbar, click  Add Material to open the Add Material window.
2
Go to the Add Material window.
3
In the tree, select Fuel Cell and Electrolyzer>Polymer Electrolytes>Nafion, EW 1100, Vapor Equilibrated, Protonated.
4
Right-click and choose Add to Component 1 (comp1).
5
In the Home toolbar, click  Add Material to close the Add Material window.
Hydrogen Fuel Cell (fc)
1
In the Settings window for Hydrogen Fuel Cell, locate the H2 Gas Mixture section.
2
Find the Transport mechanisms subsection. Select the Use Darcy’s Law for momentum transport check box.
3
Locate the O2 Gas Mixture section. Select the Use Darcy’s Law for momentum transport check box.
Membrane 1
Right-click Component 1 (comp1)>Hydrogen Fuel Cell (fc) and choose Membrane.
Hydrogen Fuel Cell (fc)
Membrane 1
1
In the Model Builder window, expand the Component 1 (comp1)>Geometry 1 node, then click Component 1 (comp1)>Hydrogen Fuel Cell (fc)>Membrane 1.
2
In the Settings window for Membrane, locate the Domain Selection section.
3
From the Selection list, choose Membrane.
Geometry 1
In the Model Builder window, collapse the Component 1 (comp1)>Geometry 1 node.
Hydrogen Fuel Cell (fc)
1
In the Model Builder window, under Component 1 (comp1) click Hydrogen Fuel Cell (fc).
2
In the Settings window for Hydrogen Fuel Cell, click to expand the Membrane Transport section.
3
Select the Electroosmotic water drag check box.
Initial Values 1
1
In the Model Builder window, under Component 1 (comp1)>Hydrogen Fuel Cell (fc)>Membrane 1 click Initial Values 1.
2
In the Settings window for Initial Values, locate the Initial Values section.
3
In the aw,0 text field, type (RH_cath+RH_an)/2.
4
In the T0 text field, type T_hum.
Water Absorption-Desorption, H2 Side 1
1
In the Model Builder window, click Water Absorption-Desorption, H2 Side 1.
2
In the Settings window for Water Absorption-Desorption, H2 Side, locate the Absorption-Desorption Condition section.
3
From the Electrolyte material list, choose Nafion, EW 1100, Vapor Equilibrated, Protonated (mat1).
Water Absorption-Desorption, O2 Side 1
1
In the Model Builder window, click Water Absorption-Desorption, O2 Side 1.
2
In the Settings window for Water Absorption-Desorption, O2 Side, locate the Absorption-Desorption Condition section.
3
From the Electrolyte material list, choose Nafion, EW 1100, Vapor Equilibrated, Protonated (mat1).
H2 Gas Diffusion Layer 1
1
In the Physics toolbar, click  Domains and choose H2 Gas Diffusion Layer.
2
In the Settings window for H2 Gas Diffusion Layer, locate the Domain Selection section.
3
From the Selection list, choose H2 GDL.
4
Locate the Electrode Charge Transport section. From the list, choose Diagonal.
The GDLs feature anisotropy with regards to the electron conductivity. The first, second and third values on the diagonal refer to the conductivities in the x, y, and z directions, respectively.
5
In the σs table, enter the following settings:
6
Locate the Gas Transport section. In the εg text field, type epsg_GDL.
7
In the κg text field, type kappag_GDL.
O2 Gas Diffusion Layer 1
1
In the Physics toolbar, click  Domains and choose O2 Gas Diffusion Layer.
2
In the Settings window for O2 Gas Diffusion Layer, locate the Domain Selection section.
3
From the Selection list, choose O2 GDL.
4
Locate the Electrode Charge Transport section. From the list, choose Diagonal.
5
In the σs table, enter the following settings:
6
Locate the Gas Transport section. In the εg text field, type epsg_GDL.
7
In the κg text field, type kappag_GDL.
H2 Gas Flow Channel 1
1
In the Physics toolbar, click  Domains and choose H2 Gas Flow Channel.
2
In the Settings window for H2 Gas Flow Channel, locate the Domain Selection section.
3
From the Selection list, choose H2 Channels.
4
Locate the Gas Transport section. From the list, choose Straight channels.
5
In the H text field, type H_ch.
6
In the W text field, type W_ch.
O2 Gas Flow Channel 1
1
In the Physics toolbar, click  Domains and choose O2 Gas Flow Channel.
2
In the Settings window for O2 Gas Flow Channel, locate the Domain Selection section.
3
From the Selection list, choose O2 Channels.
4
Locate the Gas Transport section. From the list, choose Straight channels.
5
In the H text field, type H_ch.
6
In the W text field, type W_ch.
Thin H2 Gas Diffusion Electrode 1
1
In the Physics toolbar, click  Boundaries and choose Thin H2 Gas Diffusion Electrode.
2
In the Settings window for Thin H2 Gas Diffusion Electrode, locate the Boundary Selection section.
3
From the Selection list, choose H2 GDE.
4
Locate the Electrode Thickness section. In the dgde text field, type L_CL.
Thin H2 Gas Diffusion Electrode Reaction 1
1
In the Model Builder window, click Thin H2 Gas Diffusion Electrode Reaction 1.
2
In the Settings window for Thin H2 Gas Diffusion Electrode Reaction, locate the Electrode Kinetics section.
3
In the i0,ref(T) text field, type i0_H2_ref.
4
Locate the Active Specific Surface Area section. In the av text field, type a_CL.
Thin O2 Gas Diffusion Electrode 1
1
In the Physics toolbar, click  Boundaries and choose Thin O2 Gas Diffusion Electrode.
2
In the Settings window for Thin O2 Gas Diffusion Electrode, locate the Boundary Selection section.
3
From the Selection list, choose O2 GDE.
4
Locate the Electrode Thickness section. In the dgde text field, type L_CL.
Thin O2 Gas Diffusion Electrode Reaction 1
1
In the Model Builder window, click Thin O2 Gas Diffusion Electrode Reaction 1.
2
In the Settings window for Thin O2 Gas Diffusion Electrode Reaction, locate the Electrode Kinetics section.
3
In the i0,ref(T) text field, type i0_O2_ref.
4
In the αa text field, type 3.
5
Locate the Active Specific Surface Area section. In the av text field, type a_CL.
Electronic Conducting Phase 1
In the Model Builder window, under Component 1 (comp1)>Hydrogen Fuel Cell (fc) click Electronic Conducting Phase 1.
Initial Values, O2 Domains 1
1
In the Physics toolbar, click  Attributes and choose Initial Values, O2 Domains.
2
In the Settings window for Initial Values, O2 Domains, locate the Domain Selection section.
3
From the Selection list, choose All domains.
Electronic Conducting Phase 1
In the Model Builder window, click Electronic Conducting Phase 1.
Electric Ground 1
1
In the Physics toolbar, click  Attributes and choose Electric Ground.
2
In the Settings window for Electric Ground, locate the Boundary Selection section.
3
From the Selection list, choose H2 Current Collector.
Electronic Conducting Phase 1
In the Model Builder window, click Electronic Conducting Phase 1.
Electrode Current 1
1
In the Physics toolbar, click  Attributes and choose Electrode Current.
2
In the Settings window for Electrode Current, locate the Boundary Selection section.
3
From the Selection list, choose O2 Current Collector.
4
Locate the Electrode Current section. In the Is,total text field, type -I_tot.
Initial Values 1
1
In the Model Builder window, under Component 1 (comp1)>Hydrogen Fuel Cell (fc)>H2 Gas Phase 1 click Initial Values 1.
2
In the Settings window for Initial Values, locate the Initial Composition section.
3
In the x0,H2O text field, type x_H2O_an.
H2 Gas Phase 1
In the Model Builder window, click H2 Gas Phase 1.
H2 Inlet 1
1
In the Physics toolbar, click  Attributes and choose H2 Inlet.
2
In the Settings window for H2 Inlet, locate the Boundary Selection section.
3
From the Selection list, choose H2 Inlets.
Specify the mass flow rates to make the inlet gas flow proportional to the cell current.
4
Locate the Mixture Specification section. From the list, choose Mass flow rates.
5
In the J0,H2O text field, type m_H2O_an.
6
In the ω0,bnd,H2O text field, type w_H2O_an.
7
Locate the Flow Boundary Condition section. From the list, choose Total mass flow rate.
8
In the J0 text field, type m_an.
H2 Gas Phase 1
In the Model Builder window, click H2 Gas Phase 1.
H2 Outlet 1
1
In the Physics toolbar, click  Attributes and choose H2 Outlet.
2
In the Settings window for H2 Outlet, locate the Boundary Selection section.
3
From the Selection list, choose H2 Outlets.
Initial Values 1
1
In the Model Builder window, under Component 1 (comp1)>Hydrogen Fuel Cell (fc)>O2 Gas Phase 1 click Initial Values 1.
2
In the Settings window for Initial Values, locate the Initial Composition section.
3
In the x0,H2O text field, type x_H2O_cath.
4
In the x0,N2 text field, type x_N2_cath.
O2 Gas Phase 1
In the Model Builder window, click O2 Gas Phase 1.
O2 Inlet 1
1
In the Physics toolbar, click  Attributes and choose O2 Inlet.
2
In the Settings window for O2 Inlet, locate the Boundary Selection section.
3
From the Selection list, choose O2 Inlets.
4
Locate the Mixture Specification section. From the list, choose Mass flow rates.
5
In the J0,H2O text field, type m_H2O_cath.
6
In the J0,N2 text field, type m_N2.
7
In the ω0,bnd,H2O text field, type w_H2O_cath.
8
In the ω0,bnd,N2 text field, type w_N2.
9
Locate the Flow Boundary Condition section. From the list, choose Total mass flow rate.
10
In the J0 text field, type m_cath.
O2 Gas Phase 1
In the Model Builder window, click O2 Gas Phase 1.
O2 Outlet 1
1
In the Physics toolbar, click  Attributes and choose O2 Outlet.
2
In the Settings window for O2 Outlet, locate the Boundary Selection section.
3
From the Selection list, choose O2 Outlets.
Global Definitions
Default Model Inputs
1
In the Model Builder window, under Global Definitions click Default Model Inputs.
2
In the Settings window for Default Model Inputs, locate the Browse Model Inputs section.
3
In the tree, select General>Temperature (K) - minput.T.
4
Find the Expression for remaining selection subsection. In the Temperature text field, type T.
Mesh 1
A user-defined mesh is required for this model. Use mapped and swept meshed in order to reduce the total number of mesh element.
With the last Union node in the geometry sequence set to Assembly, the mesh nodes do need to match along the pair boundaries between the two parts of the assembly at the center of the membrane. In this way different swept meshes can be used on each side of the membrane.
Mapped 1
In the Mesh toolbar, click  Boundary and choose Mapped.
Size
1
In the Model Builder window, click Size.
2
In the Settings window for Size, click to expand the Element Size Parameters section.
3
In the Maximum element size text field, type W_ch/2.
Mapped 1
1
In the Model Builder window, click Mapped 1.
2
In the Settings window for Mapped, locate the Boundary Selection section.
3
From the Selection list, choose Channel Mesh Sweep Faces.
Distribution 1
1
Right-click Mapped 1 and choose Distribution.
2
In the Settings window for Distribution, locate the Edge Selection section.
3
From the Selection list, choose All edges.
4
Locate the Distribution section. From the Distribution type list, choose Predefined.
5
In the Number of elements text field, type 4.
6
In the Element ratio text field, type 2.
7
Select the Symmetric distribution check box.
Swept 1
1
In the Mesh toolbar, click  Swept.
2
In the Settings window for Swept, locate the Domain Selection section.
3
From the Geometric entity level list, choose Domain.
4
From the Selection list, choose Channel Sweep Mesh Domains.
Size 1
1
Right-click Swept 1 and choose Size.
2
In the Settings window for Size, locate the Element Size section.
3
Click the Custom button.
4
Locate the Element Size Parameters section.
5
Select the Maximum element size check box. In the associated text field, type W_ch/1.1.
6
Click  Build All.
Mapped 2
1
In the Mesh toolbar, click  Boundary and choose Mapped.
2
In the Settings window for Mapped, locate the Boundary Selection section.
3
From the Selection list, choose Mapped Mesh Current Collector Boundaries.
4
Click  Build Selected.
Free Triangular 1
1
In the Mesh toolbar, click  Boundary and choose Free Triangular.
2
In the Settings window for Free Triangular, locate the Boundary Selection section.
3
From the Selection list, choose Triangular Mesh Current Collector Boundaries.
4
Click  Build Selected.
Boundary Layers 1
1
In the Mesh toolbar, click  Boundary Layers.
2
In the Settings window for Boundary Layers, locate the Geometric Entity Selection section.
3
From the Geometric entity level list, choose Boundary.
4
From the Selection list, choose Current Collectors.
Boundary Layer Properties
1
In the Model Builder window, click Boundary Layer Properties.
2
In the Settings window for Boundary Layer Properties, locate the Edge Selection section.
3
From the Selection list, choose Channels.
4
Locate the Layers section. In the Number of layers text field, type 2.
5
From the Thickness specification list, choose First layer.
6
In the Thickness text field, type W_rib/10.
7
Click  Build Selected.
Free Tetrahedral 1
1
In the Mesh toolbar, click  Free Tetrahedral.
2
In the Settings window for Free Tetrahedral, locate the Domain Selection section.
3
From the Geometric entity level list, choose Domain.
4
From the Selection list, choose Channel Tet Mesh Domains.
Size 1
1
Right-click Free Tetrahedral 1 and choose Size.
2
In the Settings window for Size, locate the Element Size section.
3
Click the Custom button.
4
Locate the Element Size Parameters section.
5
Select the Maximum element size check box. In the associated text field, type W_ch/2.1.
6
Click  Build Selected.
Swept 2
In the Mesh toolbar, click  Swept.
Distribution 1
1
Right-click Swept 2 and choose Distribution.
2
In the Settings window for Distribution, locate the Domain Selection section.
3
From the Selection list, choose GDL.
4
Locate the Distribution section. In the Number of elements text field, type 4.
Distribution 2
1
In the Model Builder window, right-click Swept 2 and choose Distribution.
2
In the Settings window for Distribution, locate the Domain Selection section.
3
From the Selection list, choose Membrane.
4
Locate the Distribution section. In the Number of elements text field, type 4.
5
Click  Build All.
6
In the Model Builder window, collapse the Mesh 1 node.
Study 1
Step 1: Current Distribution Initialization
Change the current distribution type to also include activation overpotentials (secondary). This will make the initial values for the subsequent study steps more accurate.
1
In the Model Builder window, under Study 1 click Step 1: Current Distribution Initialization.
2
In the Settings window for Current Distribution Initialization, locate the Study Settings section.
3
From the Current distribution type list, choose Secondary.
Stationary - Pressures Only
1
In the Model Builder window, click Step 2: Stationary.
2
In the Settings window for Stationary, type Stationary - Pressures Only in the Label text field.
Create a third study step that will solve for the whole problem, for a range of currents densities.
Stationary - All Physics
1
In the Study toolbar, click  Study Steps and choose Stationary>Stationary.
2
In the Settings window for Stationary, type Stationary - All Physics in the Label text field.
3
Click to expand the Study Extensions section. Select the Auxiliary sweep check box.
4
5
Generate the default solver and make some manual changes.
Solution 1 (sol1)
1
In the Study toolbar, click  Show Default Solver.
2
In the Model Builder window, expand the Solution 1 (sol1) node, then click Dependent Variables 2.
3
In the Settings window for Dependent Variables, locate the General section.
4
From the Defined by study step list, choose User defined.
The second study step should only solve for pressure variables.
5
In the Model Builder window, expand the Study 1>Solver Configurations>Solution 1 (sol1)>Dependent Variables 2 node, then click Chemical potential (comp1.fc.mu0).
6
In the Settings window for Field, locate the General section.
7
Clear the Solve for this field check box.
8
In the Model Builder window, under Study 1>Solver Configurations>Solution 1 (sol1)>Dependent Variables 2 click Electrolyte potential (comp1.fc.phil).
9
In the Settings window for Field, locate the General section.
10
Clear the Solve for this field check box.
11
In the Model Builder window, under Study 1>Solver Configurations>Solution 1 (sol1)>Dependent Variables 2 click Electric potential (comp1.fc.phis).
12
In the Settings window for Field, locate the General section.
13
Clear the Solve for this field check box.
14
In the Model Builder window, under Study 1>Solver Configurations>Solution 1 (sol1)>Dependent Variables 2 click Mass fraction (comp1.fc.wH2O_H2).
15
In the Settings window for Field, locate the General section.
16
Clear the Solve for this field check box.
17
In the Model Builder window, under Study 1>Solver Configurations>Solution 1 (sol1)>Dependent Variables 2 click Mass fraction (comp1.fc.wH2O_O2).
18
In the Settings window for Field, locate the General section.
19
Clear the Solve for this field check box.
20
In the Model Builder window, under Study 1>Solver Configurations>Solution 1 (sol1)>Dependent Variables 2 click Mass fraction (comp1.fc.wN2_O2).
21
In the Settings window for Field, locate the General section.
22
Clear the Solve for this field check box.
23
In the Model Builder window, under Study 1>Solver Configurations>Solution 1 (sol1)>Dependent Variables 2 click Electric potential on boundary (comp1.fc.ecph1.ec1.phis0).
24
In the Settings window for State, locate the General section.
25
Clear the Solve for this state check box.
26
In the Model Builder window, under Study 1>Solver Configurations>Solution 1 (sol1)>Dependent Variables 2 click Boundary mass fraction (comp1.fc.h2gasph1.h2in1.wbndH2O).
27
In the Settings window for State, locate the General section.
28
Clear the Solve for this state check box.
29
In the Model Builder window, under Study 1>Solver Configurations>Solution 1 (sol1)>Dependent Variables 2 click Boundary mass fraction (comp1.fc.o2gasph1.o2in1.wbndH2O).
30
In the Settings window for State, locate the General section.
31
Clear the Solve for this state check box.
32
In the Model Builder window, under Study 1>Solver Configurations>Solution 1 (sol1)>Dependent Variables 2 click Boundary mass fraction (comp1.fc.o2gasph1.o2in1.wbndN2).
33
In the Settings window for State, locate the General section.
34
Clear the Solve for this state check box.
All the modified nodes are marked with a small * in the corresponding icon in the model tree. Inspect all subnodes under the Dependent Variables 2 node and make sure that all non-pressure variables are marked with a (*), and that all 4 pressure variables are left unmodified. (Two of the pressure variables are the pressures on each side of the membrane. The other two pressures are auxiliary variables used to implement the total mass flow rate inlet conditions.)
35
In the Model Builder window, collapse the Solution 1 (sol1) node.
36
In the Study toolbar, click  Compute.
The model should now solve in a minute or two.
You may now proceed to reproduce the plots from the Results and Discussion section (but for your smaller geometry) as follows:
Results
Mole Fraction, H2, Streamline (fc)
1
In the Model Builder window, under Results click Mole Fraction, H2, Streamline (fc).
2
In the Settings window for 3D Plot Group, locate the Plot Settings section.
3
Clear the Plot dataset edges check box.
Streamline 1
1
In the Model Builder window, expand the Mole Fraction, H2, Streamline (fc) node, then click Streamline 1.
2
In the Settings window for Streamline, locate the Streamline Positioning section.
3
From the Positioning list, choose On selected boundaries.
4
Locate the Selection section. From the Selection list, choose H2 Inlets.
5
Locate the Coloring and Style section. Find the Point style subsection. From the Arrow distribution list, choose Equal time.
6
In the Mole Fraction, H2, Streamline (fc) toolbar, click  Plot.
Mole Fraction, O2, Streamline (fc)
1
In the Model Builder window, under Results click Mole Fraction, O2, Streamline (fc).
2
In the Settings window for 3D Plot Group, locate the Plot Settings section.
3
Clear the Plot dataset edges check box.
Streamline 1
1
In the Model Builder window, expand the Mole Fraction, O2, Streamline (fc) node, then click Streamline 1.
2
In the Settings window for Streamline, locate the Streamline Positioning section.
3
From the Positioning list, choose On selected boundaries.
4
Locate the Selection section. From the Selection list, choose O2 Inlets.
5
Locate the Coloring and Style section. Find the Point style subsection. From the Arrow distribution list, choose Equal time.
6
In the Mole Fraction, O2, Streamline (fc) toolbar, click  Plot.
Polarization Plot
1
In the Home toolbar, click  Add Plot Group and choose 1D Plot Group.
2
In the Settings window for 1D Plot Group, type Polarization Plot in the Label text field.
Global 1
1
Right-click Polarization Plot and choose Global.
2
In the Settings window for Global, click Replace Expression in the upper-right corner of the y-Axis Data section. From the menu, choose Component 1 (comp1)>Hydrogen Fuel Cell>fc.phis0_ec1 - Electric potential on boundary - V.
Polarization Plot
1
In the Model Builder window, click Polarization Plot.
2
In the Settings window for 1D Plot Group, click to expand the Title section.
3
From the Title type list, choose None.
4
Locate the Legend section. Clear the Show legends check box.
5
In the Polarization Plot toolbar, click  Plot.
Channel Water Activity
1
In the Home toolbar, click  Add Plot Group and choose 3D Plot Group.
2
In the Settings window for 3D Plot Group, type Channel Water Activity in the Label text field.
3
Locate the Plot Settings section. Clear the Plot dataset edges check box.
Surface 1
1
Right-click Channel Water Activity and choose Surface.
2
In the Settings window for Surface, click Replace Expression in the upper-right corner of the Expression section. From the menu, choose Component 1 (comp1)>Hydrogen Fuel Cell>fc.aw - Water activity (relative humidity).
Selection 1
1
Right-click Surface 1 and choose Selection.
2
In the Settings window for Selection, locate the Selection section.
3
From the Selection list, choose Channels.
4
In the Channel Water Activity toolbar, click  Plot.
Membrane Water Activity
1
In the Model Builder window, right-click Channel Water Activity and choose Duplicate.
2
In the Model Builder window, click Channel Water Activity 1.
3
In the Settings window for 3D Plot Group, type Membrane Water Activity in the Label text field.
Selection 1
1
In the Model Builder window, expand the Results>Membrane Water Activity>Surface 1 node, then click Selection 1.
2
In the Settings window for Selection, locate the Selection section.
3
From the Selection list, choose Membrane.
Surface 1
1
In the Model Builder window, click Surface 1.
2
In the Settings window for Surface, click Replace Expression in the upper-right corner of the Expression section. From the menu, choose Component 1 (comp1)>Hydrogen Fuel Cell>Membrane transport>fc.aw_mem - Water activity (relative humidity).
3
In the Membrane Water Activity toolbar, click  Plot.
Membrane Conductivity
1
In the Model Builder window, right-click Membrane Water Activity and choose Duplicate.
2
In the Settings window for 3D Plot Group, type Membrane Conductivity in the Label text field.
Surface 1
1
In the Model Builder window, expand the Membrane Conductivity node, then click Surface 1.
2
In the Settings window for Surface, click Replace Expression in the upper-right corner of the Expression section. From the menu, choose Component 1 (comp1)>Hydrogen Fuel Cell>Electrolyte conductivity - S/m>fc.sigmalzz - Electrolyte conductivity, zz-component.
3
In the Membrane Conductivity toolbar, click  Plot.
Cross-Membrane Current Density
1
In the Model Builder window, right-click Membrane Conductivity and choose Duplicate.
2
In the Settings window for 3D Plot Group, type Cross-Membrane Current Density in the Label text field.
Surface 1
1
In the Model Builder window, expand the Cross-Membrane Current Density node, then click Surface 1.
2
In the Settings window for Surface, click Replace Expression in the upper-right corner of the Expression section. From the menu, choose Component 1 (comp1)>Hydrogen Fuel Cell>fc.nIl - Normal electrolyte current density - A/m².
Selection 1
1
In the Model Builder window, expand the Surface 1 node, then click Selection 1.
2
In the Settings window for Selection, locate the Selection section.
3
From the Selection list, choose O2 GDE.
4
In the Cross-Membrane Current Density toolbar, click  Plot.
Cross-Membrane Water Flux
1
In the Model Builder window, right-click Cross-Membrane Current Density and choose Duplicate.
2
In the Model Builder window, click Cross-Membrane Current Density 1.
3
In the Settings window for 3D Plot Group, type Cross-Membrane Water Flux in the Label text field.
Surface 1
1
In the Model Builder window, click Surface 1.
2
In the Settings window for Surface, locate the Expression section.
3
In the Expression text field, type -fc.r_abs_dsp.
4
In the Cross-Membrane Water Flux toolbar, click  Plot.
Global Definitions
Geometry Parameters
Now that you know the model runs, proceed to solve for the full geometry.
1
In the Model Builder window, under Global Definitions click Geometry Parameters.
2
In the Settings window for Parameters, locate the Parameters section.
3
Geometry 1
1
In the Home toolbar, click  Build All.
2
Click the  Zoom Extents button in the Graphics toolbar.
Global Definitions
Physics Parameters
1
In the Model Builder window, under Global Definitions click Physics Parameters.
2
In the Settings window for Parameters, locate the Parameters section.
3
Study 1
Solution 1 (sol1)
Make a copy of the small geometry solution for future reference.
1
In the Model Builder window, under Study 1>Solver Configurations right-click Solution 1 (sol1) and choose Solution>Copy.
Solution - Small Geometry
1
In the Model Builder window, under Study 1>Solver Configurations click Solution 1 - Copy 1 (sol4).
2
In the Settings window for Solution, type Solution - Small Geometry in the Label text field.
Solver Configurations
Reset the solver sequence in order to generate a solver sequence suitable for the increased geometry size.
Solution 1 (sol1)
1
In the Model Builder window, expand the Study 1 node.
2
Right-click Solver Configurations and choose Reset Solver to Default.
3
In the Model Builder window, expand the Solution 1 (sol1) node, then click Dependent Variables 2.
4
In the Settings window for Dependent Variables, locate the General section.
5
From the Defined by study step list, choose User defined.
The second study step should only solve for pressure variables.
6
In the Model Builder window, expand the Study 1>Solver Configurations>Solution 1 (sol1)>Dependent Variables 2 node, then click Chemical potential (comp1.fc.mu0).
7
In the Settings window for Field, locate the General section.
8
Clear the Solve for this field check box.
9
In the Model Builder window, click Electrolyte potential (comp1.fc.phil).
10
In the Settings window for Field, locate the General section.
11
Clear the Solve for this field check box.
12
In the Model Builder window, click Electric potential (comp1.fc.phis).
13
In the Settings window for Field, locate the General section.
14
Clear the Solve for this field check box.
15
In the Model Builder window, click Mass fraction (comp1.fc.wH2O_H2).
16
In the Settings window for Field, locate the General section.
17
Clear the Solve for this field check box.
18
In the Model Builder window, click Mass fraction (comp1.fc.wH2O_O2).
19
In the Settings window for Field, locate the General section.
20
Clear the Solve for this field check box.
21
In the Model Builder window, click Mass fraction (comp1.fc.wN2_O2).
22
In the Settings window for Field, locate the General section.
23
Clear the Solve for this field check box.
24
In the Model Builder window, click Electric potential on boundary (comp1.fc.ecph1.ec1.phis0).
25
In the Settings window for State, locate the General section.
26
Clear the Solve for this state check box.
27
In the Model Builder window, click Boundary mass fraction (comp1.fc.h2gasph1.h2in1.wbndH2O).
28
In the Settings window for State, locate the General section.
29
Clear the Solve for this state check box.
30
In the Model Builder window, click Boundary mass fraction (comp1.fc.o2gasph1.o2in1.wbndH2O).
31
In the Settings window for State, locate the General section.
32
Clear the Solve for this state check box.
33
In the Model Builder window, click Boundary mass fraction (comp1.fc.o2gasph1.o2in1.wbndN2).
34
In the Settings window for State, locate the General section.
35
Clear the Solve for this state check box.
All the modified nodes are marked with a small * in the corresponding icon in the model tree. Inspect all subnodes under the Dependent Variables 2 node and make sure that all non-pressure variables are marked with a (*), and that all 4 pressure variables are left unmodified. (Two of the pressure variables are the pressures on each side of the membrane. The other two pressures are auxiliary variables used to implement the total mass flow rate inlet conditions.)
Step 3: Stationary - All Physics
Plot the channel water activity while solving to monitor the solver progress.
1
In the Model Builder window, under Study 1 click Step 3: Stationary - All Physics.
2
In the Settings window for Stationary, click to expand the Results While Solving section.
3
Select the Plot check box.
4
From the Plot group list, choose Channel Water Activity.
5
In the Home toolbar, click  Compute.
The larger geometry will take about 10 min to solve.