PDF

Transport Phenomena in a Polymer Electrolyte Fuel Cell Membrane-Electrode Assembly
Introduction
The membrane-electrode assembly (MEA) of a polymer electrolyte membrane fuel cell is the core component of the fuel cell system. The central part of the MEA is the polymer electrolyte membrane, which acts as a gas separator and ion conductor. Porous catalytic layers (gas diffusion electrodes) are located adjacent to the membrane, one on each side. The catalytic layers contain three separate phases: gas pores for the reactants, an electron-conducting electrode phase and an ion-conducting polymer (ionomer) electrolyte phase. The surface of the electrode phase in the catalytic layers contain noble metal catalysts in order to minimize the reaction overpotentials. Gas diffusion layers (GDLs) are placed outside the catalytic layers. The GDLs are also porous and perform the task of conducting electrons and allowing the passage of gases.
For low-temperature fuel cells, water management is of crucial importance for the performance of the MEA. Running the cell under too wet conditions may result in mass transport limitations of gases due to flooding of liquid water in the pores, whereas running the cell under too dry conditions may result in poor performance due to a low ohmic conductivity in the ionomer used in the membrane and catalytic layers.
This tutorial models how the relative humidity of the inlet gases impacts the performance of a low-temperature polymer electrolyte MEA. The model includes gas phase mass transport, water transport in the ionomer and humidity-dependent ionomer conductivity. The model non-isothermal, with the electrochemical reactions and Joule heating in the electrodes and ionomer giving rise to heat sources. Hydrogen cross-diffusion over the ionomer membrane is also included in the model.
Model Definition
Geometry
The model is defined in 1D and includes the anode and cathode GDLs, catalytic layers and the ionomer membrane. The GDLs are further divided into a two separate layers, one macroporous and one microporous layer (MPL), where the MPL is located toward the membrane. The model geometry is shown in Figure 1.
Figure 1: Model geometry.
The following two physics interfaces are used to describe the different coupled phenomena:
The Hydrogen Fuel Cell interface is used to describe the transfer of charge in the electrode and electrolyte (ionomer) phases using Ohm’s law, where the ionomer conductivity depends on the water content as will be described below. Concentration-dependent kinetic expressions are used to set up the anodic and cathodic porous electrode charge transfer reactions. The Hydrogen Fuel Cell interface is also used to model the mass transfer of the species in the gas phases on each side of the membrane using the Maxwell-Stefan equations. The mass fractions of hydrogen and water vapor are solved for on the anode side. On the cathode side, the mass fractions of nitrogen, oxygen, and water vapor are solved for. Source terms related to the porous electrode reactions and water phase transfer are added in the catalytic layer domains.
The Membrane Transport features of the Hydrogen Fuel Cell interface are used to model the transport of water in the ionomer phase in the catalytic layer and the membrane domains. The molecular flux of water depends both on chemical potential gradient-driven permeation and electroosmotic drag, using experimentally estimated parameters available in the Nafion material in the Fuel Cell and Electrolyzer Material Library.
water uptake and Ionomer properties
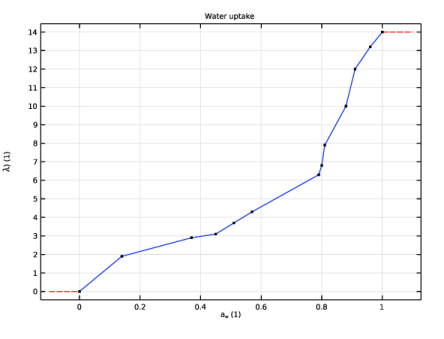
To describe the water and charge transport in the ionomer, additional expressions and data for ionomer conductivity and water activity and diffusivity in the ionomer are required. The water activity will be used to define the water transfer rate between the gas and ionomer phases. The water uptake parameter λ (dimensionless) defines the water content of the ionomer as
(1)
where c (SI unit: mol/m3) is the water concentration, MEW (SI unit: kg/mol) the equivalent weight and ρionomer (SI unit: kg/m3) the ionomer density. The equivalent weight is defined as the molecular mass of the ionomer per sulfonic acid group attached to the polymer backbone.
The water activity in the ionomer phase, (dimensionless), and λ are interrelated using an empirical expression the Nafion material node in the material library as, shown in Figure 2.
Figure 2: Water uptake versus water activity in the ionomer.
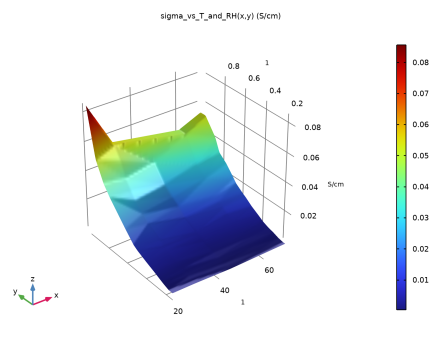
The electrolyte conductivity σl (SI unit: S/m) is defined as a function of both temperature and relative humidity as shown in Figure 2.
Figure 3: Electrolyte conductivity versus temperature and relative humidity.
Hydrogen cross-over transport through the membrane
Hydrogen diffusing from the anode side through the membrane is assumed to be oxidized as soon as it reaches the cathode catalytic layer according to:
(2)
Assuming the hydrogen concentration to be zero at the membrane-cathode catalytic boundary and in equilibrium with gaseous hydrogen on the anode side, the flux of hydrogen though the membrane is defined as
(3)
where H2 (SI unit: m2/s) is the hydrogen permeation coefficient in the ionomer (incorporating the hydrogen gas-ionomer phase transfer partition constant) and Lmem is the membrane thickness.
The hydrogen oxidation current is added to the charge balance as a boundary electrolyte current density contribution
(4)
Water Membrane-gas phase transfer
The water transfer rate between the gas pores and the ionomer phase at the membrane boundary, NH2O (SI unit: mol/(m2·s)), is defined using reaction source/sink terms in the catalytic layers:
(5)
where (SI unit: mol/(m2·s)) is an absorption rate constant.
In the gas phase, the water activity is defined as
(6)
where xH2O (1) is the water molar fraction in the gas phase, pvapor (SI unit: Pa) is the water vapor pressure, and p (SI unit: Pa) is the pressure.
Results and Discussion
Figure 4 shows the polarization plots (cell potential versus cell current density) for different relative humidities of the gases at the external GDL boundaries. Having both gas streams humidified to 95% results in the highest currents. The figure also shows that humidifying the anode to 95% and the cathode to 50% renders better performance than humidifying the anode to 50% and the cathode to 95%. 50% relative humidity on both electrodes results in the worst performance.
The open-circuit voltage around 0.95 V is significantly lower than the reversible potential of the cell reaction (approximately 1.18 V at 60ºC). This is due to the cathodic polarization for oxygen reduction needed at open circuit to balance the parasitic hydrogen oxidation reaction on the cathode side due to the hydrogen transport through the membrane.
Figure 4: Polarization plots for various relative humidities of the gases in the anode and cathode compartments.
Figure 5 and Figure 6 show the water activity for the different humidity levels for the cell operating at 0.5 V and the corresponding ionomer conductivity, respectively. The anode humidified to 70% and the cathode to 95% results in a higher membrane conductivity than for the opposite 95%-70% anode-cathode case, thus explaining the differences in cell performance seen in Figure 4.
shows the temperature profile in the fuel cell. A temperature increase of about 3C is observed for the highest current level. This temperature increase explains the generally lower relative humidity levels seen in the central parts of the MEA compared to the outer parts of the GDLs seen in Figure 5.
Figure 5: Water activity in the ionomer and gas phases for varied relative humidities and the cell operating at 0.5 V.
Figure 6: Ionomer conductivity for varied relative humidities and the cell operating at 0.5 V.
Figure 7: Temperature profile in the MEA for the cell operating at 0.5 V.
Application Library path: Fuel_Cell_and_Electrolyzer_Module/Fuel_Cells/pem_mea_1d
Modeling Instructions
From the File menu, choose New.
New
In the New window, click  Model Wizard.
Model Wizard
1
In the Model Wizard window, click  1D.
2
In the Select Physics tree, select Electrochemistry>Hydrogen Fuel Cells>Proton Exchange (fc).
3
Click Add.
4
In the Select Physics tree, select Heat Transfer>Heat Transfer in Solids (ht).
5
Click Add.
6
Click  Study.
7
In the Select Study tree, select Preset Studies for Selected Physics Interfaces>Hydrogen Fuel Cell>Stationary with Initialization.
8
Global Definitions
Parameters 1
1
In the Model Builder window, under Global Definitions click Parameters 1.
2
In the Settings window for Parameters, locate the Parameters section.
3
Click  Load from File.
4
Geometry 1
Construct the model geometry using seven separate intervals.
Anode GDL
1
In the Model Builder window, under Component 1 (comp1) right-click Geometry 1 and choose Interval.
2
In the Settings window for Interval, type Anode GDL in the Label text field.
3
Locate the Interval section. In the table, enter the following settings:
4
Locate the Selections of Resulting Entities section. Select the Resulting objects selection check box.
Anode MPL
1
In the Model Builder window, right-click Geometry 1 and choose Interval.
2
In the Settings window for Interval, type Anode MPL in the Label text field.
3
Locate the Interval section. In the table, enter the following settings:
4
Locate the Selections of Resulting Entities section. Select the Resulting objects selection check box.
Anode CL
1
Right-click Geometry 1 and choose Interval.
2
In the Settings window for Interval, type Anode CL in the Label text field.
3
Locate the Interval section. In the table, enter the following settings:
4
Locate the Selections of Resulting Entities section. Select the Resulting objects selection check box.
Membrane
1
Right-click Geometry 1 and choose Interval.
2
In the Settings window for Interval, type Membrane in the Label text field.
3
Locate the Interval section. In the table, enter the following settings:
4
Locate the Selections of Resulting Entities section. Select the Resulting objects selection check box.
Cathode CL
1
Right-click Geometry 1 and choose Interval.
2
In the Settings window for Interval, type Cathode CL in the Label text field.
3
Locate the Interval section. In the table, enter the following settings:
4
Locate the Selections of Resulting Entities section. Select the Resulting objects selection check box.
Cathode MPL
1
Right-click Geometry 1 and choose Interval.
2
In the Settings window for Interval, type Cathode MPL in the Label text field.
3
Locate the Interval section. In the table, enter the following settings:
4
Locate the Selections of Resulting Entities section. Select the Resulting objects selection check box.
Cathode GDL
1
Right-click Geometry 1 and choose Interval.
2
In the Settings window for Interval, type Cathode GDL in the Label text field.
3
Locate the Interval section. In the table, enter the following settings:
4
Locate the Selections of Resulting Entities section. Select the Resulting objects selection check box.
5
Click  Build All Objects.
6
Click the  Zoom Extents button in the Graphics toolbar.
Definitions
Now create some union selections, using the selections that were created in the geometry node by enabling the Resulting objects selection check box.
Anode Gas Compartment
1
In the Definitions toolbar, click  Union.
2
In the Settings window for Union, type Anode Gas Compartment in the Label text field.
3
Locate the Input Entities section. Under Selections to add, click  Add.
4
In the Add dialog box, in the Selections to add list, choose Anode GDL, Anode MPL, and Anode CL.
5
Cathode Gas Compartment
1
In the Definitions toolbar, click  Union.
2
In the Settings window for Union, type Cathode Gas Compartment in the Label text field.
3
Locate the Input Entities section. Under Selections to add, click  Add.
4
In the Add dialog box, in the Selections to add list, choose Cathode CL, Cathode MPL, and Cathode GDL.
5
Ionomer Domains
1
In the Definitions toolbar, click  Union.
2
In the Settings window for Union, type Ionomer Domains in the Label text field.
3
Locate the Input Entities section. Under Selections to add, click  Add.
4
In the Add dialog box, in the Selections to add list, choose Anode CL, Membrane, and Cathode CL.
5
CLs
1
In the Definitions toolbar, click  Union.
2
In the Settings window for Union, type CLs in the Label text field.
3
Locate the Input Entities section. Under Selections to add, click  Add.
4
In the Add dialog box, in the Selections to add list, choose Anode CL and Cathode CL.
5
MPLs
1
In the Definitions toolbar, click  Union.
2
In the Settings window for Union, type MPLs in the Label text field.
3
Locate the Input Entities section. Under Selections to add, click  Add.
4
In the Add dialog box, in the Selections to add list, choose Anode MPL and Cathode MPL.
5
GDLs
1
In the Definitions toolbar, click  Union.
2
In the Settings window for Union, type GDLs in the Label text field.
3
Locate the Input Entities section. Under Selections to add, click  Add.
4
In the Add dialog box, in the Selections to add list, choose Anode GDL and Cathode GDL.
5
Materials
This model uses a polymer electrolyte material (Nafion) which is available in the material library. Add the material twice, and assign it first to the ionomer domains, and next to the membrane boundaries adjacent to the gas phase nodes. The boundary instance of the material will be used to provide rate constants for the water absorption-desorption reactions.
Add Material
1
In the Home toolbar, click  Add Material to open the Add Material window.
2
Go to the Add Material window.
3
In the tree, select Fuel Cell and Electrolyzer>Polymer Electrolytes>Nafion, EW 1100, Vapor Equilibrated, Protonated.
4
Right-click and choose Add to Component 1 (comp1).
Materials
Nafion, EW 1100, Vapor Equilibrated, Protonated (mat1)
1
In the Model Builder window, under Component 1 (comp1)>Materials click Nafion, EW 1100, Vapor Equilibrated, Protonated (mat1).
2
In the Settings window for Material, locate the Geometric Entity Selection section.
3
From the Selection list, choose Ionomer Domains.
Add Material
1
Go to the Add Material window.
2
In the tree, select Fuel Cell and Electrolyzer>Polymer Electrolytes>Nafion, EW 1100, Vapor Equilibrated, Protonated.
3
Right-click and choose Add to Component 1 (comp1).
4
In the Home toolbar, click  Add Material to close the Add Material window.
Materials
Nafion, EW 1100, Vapor Equilibrated, Protonated 1 (mat2)
1
In the Settings window for Material, locate the Geometric Entity Selection section.
2
From the Geometric entity level list, choose Boundary.
3
Hydrogen Fuel Cell (fc)
Set up the current distribution and transport model. Include mass transport using Maxwell-Stefan diffusion and momentum transport using Darcy’s Law in both the anode and cathode gas mixtures. Additionally, include crossover of hydrogen and oxygen and electroosmotic water drag in the membrane. Note that the default gas species are hydrogen and water on the anode side, and oxygen, nitrogen and water on the cathode side. Start with adding the relevant domain nodes.
1
In the Model Builder window, under Component 1 (comp1) click Hydrogen Fuel Cell (fc).
2
In the Settings window for Hydrogen Fuel Cell, locate the H2 Gas Mixture section.
3
Find the Transport mechanisms subsection. Select the Use Darcy’s Law for momentum transport check box.
4
Locate the O2 Gas Mixture section. Select the Use Darcy’s Law for momentum transport check box.
5
Click to expand the Membrane Transport section. Select the H2 check box.
6
Select the O2 check box.
7
Select the Electroosmotic water drag check box.
Membrane 1
1
In the Physics toolbar, click  Domains and choose Membrane.
2
In the Settings window for Membrane, locate the Domain Selection section.
3
From the Selection list, choose Membrane.
H2 Gas Diffusion Electrode 1
1
In the Physics toolbar, click  Domains and choose H2 Gas Diffusion Electrode.
2
In the Settings window for H2 Gas Diffusion Electrode, locate the Domain Selection section.
3
From the Selection list, choose Anode CL.
H2 Gas Diffusion Layer 1
1
In the Physics toolbar, click  Domains and choose H2 Gas Diffusion Layer.
2
In the Settings window for H2 Gas Diffusion Layer, locate the Domain Selection section.
3
From the Selection list, choose Anode MPL.
H2 Gas Diffusion Layer 2
1
In the Physics toolbar, click  Domains and choose H2 Gas Diffusion Layer.
2
In the Settings window for H2 Gas Diffusion Layer, locate the Domain Selection section.
3
From the Selection list, choose Anode GDL.
O2 Gas Diffusion Electrode 1
1
In the Physics toolbar, click  Domains and choose O2 Gas Diffusion Electrode.
2
In the Settings window for O2 Gas Diffusion Electrode, locate the Domain Selection section.
3
From the Selection list, choose Cathode CL.
O2 Gas Diffusion Layer 1
1
In the Physics toolbar, click  Domains and choose O2 Gas Diffusion Layer.
2
In the Settings window for O2 Gas Diffusion Layer, locate the Domain Selection section.
3
From the Selection list, choose Cathode MPL.
O2 Gas Diffusion Layer 2
1
In the Physics toolbar, click  Domains and choose O2 Gas Diffusion Layer.
2
In the Settings window for O2 Gas Diffusion Layer, locate the Domain Selection section.
3
From the Selection list, choose Cathode GDL.
In the Electrolyte Phase node, the electrolyte conductivity is set to be taken from the Materials node. Inspect the settings in the H2 Gas Phase and O2 Gas Phase nodes. Note that the density and viscosity of the gas mixture, and the binary diffusion coefficients are calculated automatically when the respective default settings are used.
The properties for hydrogen and oxygen crossover and electroosmotic water drag in the Membrane node and in the child nodes that added by default are automatically taken from the Materials node.
Initial Values 1
1
In the Model Builder window, expand the Membrane 1 node, then click Initial Values 1.
2
In the Settings window for Initial Values, locate the Initial Values section.
3
In the T0 text field, type T0.
H2 Gas Diffusion Electrode 1
Set up the properties of the H2 Gas Diffusion Electrode node. The details of electrode kinetics are set in the child node. Note that the reference equilibrium potential is calculated automatically when the default Built in option is used.
1
In the Model Builder window, under Component 1 (comp1)>Hydrogen Fuel Cell (fc) click H2 Gas Diffusion Electrode 1.
2
In the Settings window for H2 Gas Diffusion Electrode, locate the Electrode Charge Transport section.
3
In the σs text field, type sigmas_CL.
4
Locate the Effective Electrolyte Charge Transport section. In the εl text field, type epsl_CL.
5
Locate the Gas Transport section. In the εg text field, type epsg_CL.
6
In the κg text field, type kappag_CL.
H2 Gas Diffusion Electrode Reaction 1
1
In the Model Builder window, click H2 Gas Diffusion Electrode Reaction 1.
2
In the Settings window for H2 Gas Diffusion Electrode Reaction, locate the Electrode Kinetics section.
3
In the i0,ref(T) text field, type i0_H2.
4
Locate the Active Specific Surface Area section. In the av text field, type a_CL.
H2 Gas Diffusion Layer 1 - MPL
Set up the properties of the anode microporous layer and the anode gas diffusion layer in the H2 Gas Diffusion Layer nodes.
1
In the Model Builder window, under Component 1 (comp1)>Hydrogen Fuel Cell (fc) click H2 Gas Diffusion Layer 1.
2
In the Settings window for H2 Gas Diffusion Layer, type H2 Gas Diffusion Layer 1 - MPL in the Label text field.
3
Locate the Electrode Charge Transport section. In the σs text field, type sigmas_MPL.
4
Locate the Gas Transport section. In the εg text field, type epsg_MPL.
5
In the κg text field, type kappag_MPL.
H2 Gas Diffusion Layer 2 - GDL
1
In the Model Builder window, click H2 Gas Diffusion Layer 2.
2
In the Settings window for H2 Gas Diffusion Layer, type H2 Gas Diffusion Layer 2 - GDL in the Label text field.
3
Locate the Electrode Charge Transport section. In the σs text field, type sigmas_GDL.
4
Locate the Gas Transport section. In the εg text field, type epsg_GDL.
5
In the κg text field, type kappag_GDL.
O2 Gas Diffusion Electrode 1
Set up the properties of the O2 Gas Diffusion Electrode node. The details of electrode kinetics are set in the child node. Note that the reference equilibrium potential is calculated automatically when the default Built in option is used.
1
In the Model Builder window, click O2 Gas Diffusion Electrode 1.
2
In the Settings window for O2 Gas Diffusion Electrode, locate the Electrode Charge Transport section.
3
In the σs text field, type sigmas_CL.
4
Locate the Effective Electrolyte Charge Transport section. In the εl text field, type epsl_CL.
5
Locate the Gas Transport section. In the εg text field, type epsg_CL.
6
In the κg text field, type kappag_CL.
O2 Gas Diffusion Electrode Reaction 1
1
In the Model Builder window, click O2 Gas Diffusion Electrode Reaction 1.
2
In the Settings window for O2 Gas Diffusion Electrode Reaction, locate the Electrode Kinetics section.
3
In the i0,ref(T) text field, type i0_O2.
4
In the αa text field, type alphaa_O2.
5
Locate the Active Specific Surface Area section. In the av text field, type a_CL.
O2 Gas Diffusion Layer 1 - MPL
Set up the properties of the cathode microporous layer and the cathode gas diffusion layer in the O2 Gas Diffusion Layer nodes.
1
In the Model Builder window, under Component 1 (comp1)>Hydrogen Fuel Cell (fc) click O2 Gas Diffusion Layer 1.
2
In the Settings window for O2 Gas Diffusion Layer, type O2 Gas Diffusion Layer 1 - MPL in the Label text field.
3
Locate the Electrode Charge Transport section. In the σs text field, type sigmas_MPL.
4
Locate the Gas Transport section. In the εg text field, type epsg_MPL.
5
In the κg text field, type kappag_MPL.
O2 Gas Diffusion Layer 2 - GDL
1
In the Model Builder window, click O2 Gas Diffusion Layer 2.
2
In the Settings window for O2 Gas Diffusion Layer, type O2 Gas Diffusion Layer 2 - GDL in the Label text field.
3
Locate the Electrode Charge Transport section. In the σs text field, type sigmas_GDL.
4
Locate the Gas Transport section. In the εg text field, type epsg_GDL.
5
In the κg text field, type kappag_GDL.
Finally, set up the boundary conditions and initial values.
Electronic Conducting Phase 1
In the Model Builder window, click Electronic Conducting Phase 1.
Electric Ground 1
1
In the Physics toolbar, click  Attributes and choose Electric Ground.
2
Electronic Conducting Phase 1
In the Model Builder window, click Electronic Conducting Phase 1.
Electric Potential 1
1
In the Physics toolbar, click  Attributes and choose Electric Potential.
2
3
In the Settings window for Electric Potential, locate the Electric Potential section.
4
In the φs,bnd text field, type E_cell.
Initial Values 1
1
In the Model Builder window, under Component 1 (comp1)>Hydrogen Fuel Cell (fc)>H2 Gas Phase 1 click Initial Values 1.
2
In the Settings window for Initial Values, locate the Initial Composition section.
3
From the Mixture specification list, choose Humidified mixture.
4
In the RHhum text field, type RH_an.
5
In the Thum text field, type T0.
H2 Gas Phase 1
In the Model Builder window, click H2 Gas Phase 1.
H2 Inlet 1
1
In the Physics toolbar, click  Attributes and choose H2 Inlet.
2
Initial Values 1
1
In the Model Builder window, under Component 1 (comp1)>Hydrogen Fuel Cell (fc)>O2 Gas Phase 1 click Initial Values 1.
2
In the Settings window for Initial Values, locate the Initial Composition section.
3
From the Mixture specification list, choose Humidified air.
4
In the RHhum text field, type RH_cath.
5
In the Thum text field, type T0.
O2 Gas Phase 1
In the Model Builder window, click O2 Gas Phase 1.
O2 Inlet 1
1
In the Physics toolbar, click  Attributes and choose O2 Inlet.
2
Now set up the Heat Transfer physics. The Nafion material contains data for the thermal conductivity in the membrane. Use user-defined thermal conductivities for the other domains.
Heat Transfer in Solids (ht)
In the Model Builder window, under Component 1 (comp1) click Heat Transfer in Solids (ht).
Solid 2 - GDLs
1
In the Physics toolbar, click  Domains and choose Solid.
2
In the Settings window for Solid, type Solid 2 - GDLs in the Label text field.
3
Locate the Domain Selection section. From the Selection list, choose GDLs.
4
Locate the Heat Conduction, Solid section. From the k list, choose User defined. In the associated text field, type kappa_GDL.
Solid 3 - MPLs
1
In the Physics toolbar, click  Domains and choose Solid.
2
In the Settings window for Solid, type Solid 3 - MPLs in the Label text field.
3
Locate the Domain Selection section. From the Selection list, choose MPLs.
4
Locate the Heat Conduction, Solid section. From the k list, choose User defined. In the associated text field, type kappa_MPL.
Solid 4 - CLs
1
In the Physics toolbar, click  Domains and choose Solid.
2
In the Settings window for Solid, type Solid 4 - CLs in the Label text field.
3
Locate the Domain Selection section. From the Selection list, choose CLs.
4
Locate the Heat Conduction, Solid section. From the k list, choose User defined. In the associated text field, type kappa_CL.
The Solid 1 node that was added by default should now be active on the membrane domain only.
Solid 1 - Membrane
1
In the Model Builder window, click Solid 1.
2
In the Settings window for Solid, type Solid 1 - Membrane in the Label text field.
Note that the Nafion material node under Materials is marked with a red cross, indicating an undefined material property. The missing material properties are the density and heat capacity, which are however not needed for the stationary study we will be making.
Make the density and heat capacity user defined in all domains order to remove the red cross.
3
Locate the Thermodynamics, Solid section. From the ρ list, choose User defined. From the Cp list, choose User defined.
Solid 2 - GDLs
1
In the Model Builder window, click Solid 2 - GDLs.
2
In the Settings window for Solid, locate the Thermodynamics, Solid section.
3
From the ρ list, choose User defined. From the Cp list, choose User defined.
Solid 3 - MPLs
1
In the Model Builder window, click Solid 3 - MPLs.
2
In the Settings window for Solid, locate the Thermodynamics, Solid section.
3
From the ρ list, choose User defined. From the Cp list, choose User defined.
Solid 4 - CLs
1
In the Model Builder window, click Solid 4 - CLs.
2
In the Settings window for Solid, locate the Thermodynamics, Solid section.
3
From the ρ list, choose User defined. From the Cp list, choose User defined.
Temperature 1
1
In the Physics toolbar, click  Boundaries and choose Temperature.
Finalize the heat transfer physics by setting the external temperature and the initial condition.
2
3
In the Settings window for Temperature, locate the Temperature section.
4
In the T0 text field, type T0.
Initial Values 1
1
In the Model Builder window, click Initial Values 1.
2
In the Settings window for Initial Values, locate the Initial Values section.
3
In the T text field, type T0.
Multiphysics
Electrochemical Heating 1 (ech1)
In the Physics toolbar, click  Multiphysics Couplings and choose Domain>Electrochemical Heating.
Mesh 1
1
In the Model Builder window, under Component 1 (comp1) click Mesh 1.
2
In the Settings window for Mesh, locate the Physics-Controlled Mesh section.
3
From the Element size list, choose Extra fine.
4
Locate the Sequence Type section. From the list, choose User-controlled mesh.
Distribution 1
1
In the Model Builder window, right-click Edge 1 and choose Distribution.
2
In the Settings window for Distribution, locate the Domain Selection section.
3
From the Selection list, choose CLs.
4
Locate the Distribution section. In the Number of elements text field, type 10.
5
Click  Build All.
Study 1
Parametric Sweep
1
In the Study toolbar, click  Parametric Sweep.
2
In the Settings window for Parametric Sweep, locate the Study Settings section.
3
4
5
6
7
From the Sweep type list, choose All combinations.
Step 2: Stationary
1
In the Model Builder window, click Step 2: Stationary.
2
In the Settings window for Stationary, click to expand the Study Extensions section.
3
Select the Auxiliary sweep check box.
4
5
6
In the Study toolbar, click  Compute.
Results
Polarization Plots
1
In the Home toolbar, click  Add Plot Group and choose 1D Plot Group.
2
In the Settings window for 1D Plot Group, type Polarization Plots in the Label text field.
3
Locate the Data section. From the Dataset list, choose Study 1/Parametric Solutions 1 (sol3).
Point Graph 1
1
Right-click Polarization Plots and choose Point Graph.
2
3
In the Settings window for Point Graph, click Replace Expression in the upper-right corner of the y-Axis Data section. From the menu, choose Component 1 (comp1)>Hydrogen Fuel Cell>fc.phis - Electric potential - V.
4
Locate the x-Axis Data section. From the Parameter list, choose Expression.
5
Click Replace Expression in the upper-right corner of the x-Axis Data section. From the menu, choose Component 1 (comp1)>Hydrogen Fuel Cell>fc.nIs - Normal electrode current density - A/m².
6
Click to expand the Legends section. Select the Show legends check box.
7
Find the Include subsection. Clear the Point check box.
Filter 1
1
Right-click Point Graph 1 and choose Filter.
2
In the Settings window for Filter, locate the Point Selection section.
3
In the Logical expression for inclusion text field, type fc.nIs>0.
4
In the Polarization Plots toolbar, click  Plot.
Water Activity (Relative Humidity) (fc)
1
In the Model Builder window, under Results click Water Activity (Relative Humidity) (fc).
2
In the Settings window for 1D Plot Group, locate the Data section.
3
From the Parameter selection (E_cell) list, choose Last.
Line Graph 1
1
In the Model Builder window, expand the Water Activity (Relative Humidity) (fc) node, then click Line Graph 1.
2
In the Water Activity (Relative Humidity) (fc) toolbar, click  Plot.
Ionomer Conductivity
1
In the Home toolbar, click  Add Plot Group and choose 1D Plot Group.
2
In the Settings window for 1D Plot Group, type Ionomer Conductivity in the Label text field.
3
Locate the Data section. From the Dataset list, choose Study 1/Parametric Solutions 1 (sol3).
4
From the Parameter selection (E_cell) list, choose Last.
Line Graph 1
1
Right-click Ionomer Conductivity and choose Line Graph.
2
In the Settings window for Line Graph, locate the Selection section.
3
From the Selection list, choose All domains.
4
Click Replace Expression in the upper-right corner of the y-Axis Data section. From the menu, choose Component 1 (comp1)>Hydrogen Fuel Cell>Electrolyte conductivity - S/m>fc.sigmalxx - Electrolyte conductivity, xx-component.
5
Locate the x-Axis Data section. From the Parameter list, choose Expression.
6
In the Expression text field, type x.
7
Click to expand the Legends section. Select the Show legends check box.
8
In the Ionomer Conductivity toolbar, click  Plot.