PDF

The Brüel & Kjær 4134 Condenser Microphone
Introduction
This is a model of the Brüel and Kjær 4134 condenser microphone (BK 4134). The BK 4134 is a half inch (1/2”) measurement microphone for medium and high level measurements in the audio range and for coupler measurements; see Figure 1. This microphone is of the so-called pressure response type (see Ref. 1 and Ref. 2 for further details). The main output parameter of the model is the microphone sensitivity that relates the electric output of the microphone to the acoustic pressure input. The modeled sensitivity is compared with measurement data from an actual BK 4134 microphone. The mechanical-thermal noise floor of the microphone is also determined by computing the Johnson–Nyquist noise of the system.
Figure 1: Picture of the Brüel and Kjær 4134 microphone including the protection grid mounted on the housing. Courtesy of Brüel and Kjær.
The BK 4134 microphone has been the subject of many modeling studies including both numerical, semi-analytical, and analytical models; see, for example, Ref. 3, Ref. 4, and Ref. 5. In the analytical or semi-analytical approaches, not all effects are included as, for example, the nontrivial edge effects of the electric field and thus electric forces acting on the membrane. In this COMSOL Multiphysics finite element model, several physics interfaces and features are used in a multiphysics approach to capture and couple more physical phenomena. These include:
A Thermoviscous Acoustics, Frequency Domain interface, which is the detailed acoustic physics interface that explicitly includes and solves for thermal and viscous loss effects.
An Electrostatics interface captures the changes in the electric field and electrostatic forces.
A Membrane interface, for setting up a pretensioned physics for the diaphragm.
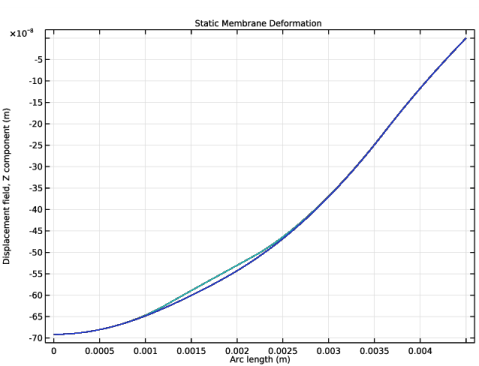
A Moving Mesh feature, for modeling the static deformation of the membrane and computational domain when prepolarizing the microphone.
Note: Many of the working principles of this microphone model are described in the Axisymmetric Condenser Microphone model. Application Library path Acoustics_Module/Electroacoustic_Transducers/condenser_microphone.
Microphone Working Principles
A schematic depiction of the microphone is given in Figure 2 including the diaphragm, backplate (or back-electrode), insulator, vent (or pressure equalization hole), housing, and protection grid. The exterior housing and diaphragm are electrically insulated from the backplate with an insulator that seals the volume inside the microphone. A small vent used for pressure equalization at low frequencies is located in the housing.
Figure 2: Schematic representation of the Brüel and Kjær 4134 microphone. Comprising the diaphragm (or membrane) and the backplate (or back electrode), the housing, the insulator, and the protection grid. The incident pressure on the microphone is pin and the pressure experienced by the vent (pressure equalization hole) is pvent. The output voltage if the microphone is Vout.
The distance h between the diaphragm and the backplate is around 19 μm. The radius of the membrane Rmic is 4.5 mm and the height Hmic is 3.35 mm. The microphone works as an electromechanical transducer. It transforms the mechanical movement of the diaphragm, induced by an external incident acoustic pressure field pin, into an electric signal Vout. The relation between the input pressure and the output voltage is the sensitivity level L, defined as
(1)
where L0 is the normalization sensitivity, here the level at 250 Hz. A charge Q0 is applied to the backplate through a very large resistor in series with a DC polarization voltage Vpol = 200 V (not in the figure). This produces an electrostatic attraction and constant small DC deformation of the diaphragm. Once the diaphragm is set in motion by the incident acoustic field, the gap distance h varies. This creates an AC voltage between the diaphragm/housing and the backplate.
The shape of the electrode, the location of the holes, and the gap thickness all control the viscothermal damping of the diaphragm motion and thus shapes the microphone response. The low frequency response is influenced by the acoustic impedance of the vent. The vent may either be exposed to the incident pressure field such that pvent = pin exp(iφ), where φ is a phase change due to distance, or unexposed (shielded) such that pvent = 0 Pa. The first configuration is the typical when the microphone is used for field measurements. The second configuration occurs, for example, when the microphone is used for acoustic coupler measurements, where only the membrane is exposed to the sound field. More details are in Ref. 1 and Ref. 2.
Model Assumptions
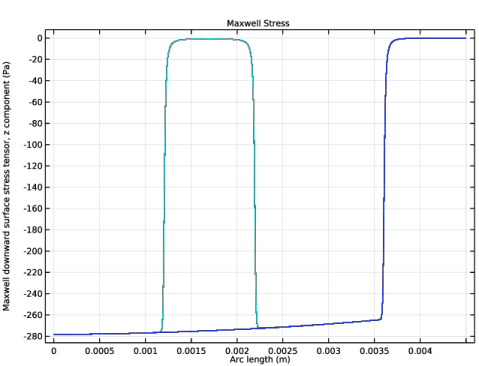
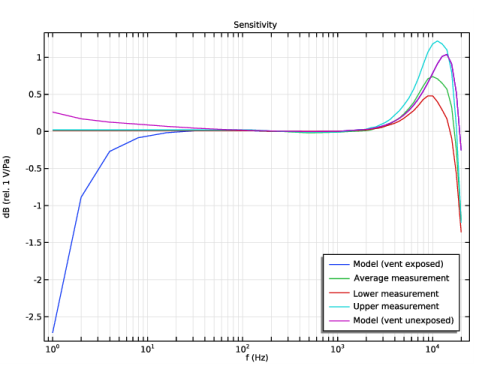
In this model it is assumed that the charge Q0 is constant. This is not fully correct. Electric interaction between the microphone and the external circuit induces small changes in the surface charge. A constant charge corresponds to charging the microphone through an infinitely large resistor. This means that only the acoustic cutoff is modeled at the low frequencies and not the usual combined electric and acoustic cutoff.
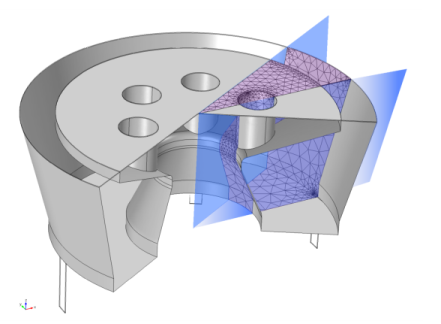
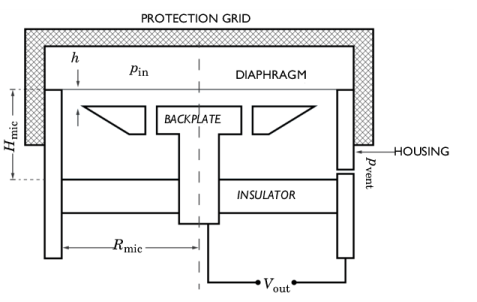
The incident pressure field pin is constant across the membrane. This is true for normal incidence. For oblique incidence, the diaphragm diameter 2Rmic becomes comparable to half a wavelength λ/2 for f = 20 kHz.
Figure 3: Geometry of the BK 4134 microphone. The computational mesh is reduced to 1/12 of the geometry using symmetries.
Mechanical-Thermal Noise Predictions
The noise floor also sometimes called thermal noise or mechanical-thermal noise (it is related to the resistive losses of a linear system) is computed for the microphone, see Ref. 6, 7, and 8. The computation is purely based on postprocessing the results of the simulation of the unexposed microphone setup. The Johnson noise or Johnson-Nyquist noise power spectral density is expressed as
(2)
where kB is Boltzmann’s constant, T0 is the ambient temperature, R = real(Za) is the resistive part of the acoustic impedance, and Δf is the frequency band width (here we will look at the per Hz values and set Δf = 1 Hz). This leads to the pressure spectral density of the noise
(3)
with the SI unit . The total weighted level of the mechanical-thermal noise, between the frequencies f1 and f2, can be computed by integrating the spectral density expression (see Ref. 8) as
(4)
where W(f) is the weighting amplitude function, for example, A-weighted, and pref is the reference pressure of 20 μPa.
The impedance Za is the acoustic input impedance to the membrane (see Fig. 4 in Ref. 5) and can conveniently be computed as
(5)
where Qmem is the average membrane volume velocity. The integral is over the membrane surface (in the model a multiplication with 12 is used to take the sector symmetry into account, the expression is defined in the loaded variables). The resistance can also be computed through the dissipated thermal and viscous heat in the microphone cavity using the (electric) relation
(6)
where Pth and Pv is the total dissipated thermal and viscous heat. The factor one half is necessary to make the denominator represents and RMS value, just as the heat terms. The heat terms are evaluated in the model as a volume integral of the thermal and viscous power dissipation density variables ta.diss_therm and ta.diss_visc (the expressions are defined in the loaded variables).
Model Definition
Geometry
The geometry of the Brüel and Kjær 4134 microphone is shown in Figure 3. The computational mesh is also shown as a 1/12 slice of the geometry. Using the symmetries of the model, the computational domain is reduced. Because of this symmetric construction the vent has been split into 6 slices (each divided into two with the symmetry) with the requirement that the total acoustic impedance of the six slices equals the original single hole.
Parameters
The parameters defined in the model are given in the table below. The properties of air are standard values from the COMSOL air material. The diaphragm is made of nickel and its material parameters are given in the table.
Tm0
Em
2.21·1011 Ps
νm
tm
μm
ρm
ρms
Q0
3.145·10-10 C
pin
pvent
fmax
dvisc
L0
Boundary Conditions
In the exposed vent configuration, the pressure at the vent is given by
(7)
where Hmic is the height of the microphone (see Figure 2), k is the wave number, ω is the angular frequency, and c = 343 m/s is the speed of sound at 20°C and 1 atm. It is here assumed that the incident sound is a plane wave normal to the diaphragm.
Details about the other boundary conditions used in this model are found in the Axisymmetric Condenser Microphone model and in the Modeling Instructions below.
Results and Discussion
The sensitivity of the microphone given by Equation 1 is shown in Figure 4. The modeled curves of the exposed and unexposed vent configurations are plotted in blue and pink, respectively. Three measurement curves of actual responses of a BK 4134 microphone are depicted in green, red, and cyan. The measured curves illustrate the variability in the sensitivity of a microphone — this is why each measurement microphone is delivered with an individual calibration curve. The measured curves are only valid from 200 Hz and upward. The microphone sensitivity is also illustrated in 1/3 octaves at the very end of this model description.
The frequency response of the microphone for frequencies below 100 Hz shows different behavior depending on the vent configuration (compare this to Fig. 2.7 in Ref. 2). In the exposed configuration the vent equalizes the pressure on both sides of the membrane (the phase lag is small) and thus reduces the pressure drop across the diaphragm, in turn reducing the sensitivity. In the unexposed configuration, the sensitivity is seen to increase at the lowest frequencies. Here the stiffness of the internal air cavity becomes smaller.
Figure 4: Microphone sensitivity curve from the model with vent exposed (blue) and vent unexposed (pink). Three measurement curves are also added (green, red, and cyan) to illustrate the variability in the microphone sensitivity.
The deformation of the membrane is shown in Figure 5 for 20 kHz and 1 kHz, top and bottom, respectively. At 20 kHz, where the sensitivity starts to fall off, the influence of the holes on the membrane deformation is visible (see for example, Ref. 4 for measured membrane modes).
The static electric potential distribution that results from prepolarizing the microphone is shown in Figure 6; notice that the maximal voltage is just over 200 V.
Figure 5: Diaphragm deformation at f = 20 kHz (top) and f = 1 kHz (bottom).
Figure 6: Static electric potential resulting from the prepolarization of the microphone cartridge and diaphragm.
Mechanical-Thermal Noise Results
The computation of the noise is based on the expressions in Equation 2 to Equation 6 and is purely postprocessing of the computed solution. The results are, for simplicity, based on the unexposed vent setup. When the vent is exposed, the equivalent circuit of the acoustic system becomes a bit more complicated as two sources are present. Some measurement data of the noise in the BK 4134 microphone can be found in Ref. 8 and Ref. 9.
The dissipated total, thermal, and viscous heat inside the microphone cavity are depicted in Figure 7 (left). The computed equivalent acoustic resistance R used for the noise computation is depicted in Figure 7 (right). The resistance is computed through both Equation 5 and Equation 6. The values of the resistance are consistent with the results from Ref. 8 (see Fig. 3 in the reference).
In the same reference, the A-weighted total noise level is also reported (see Table II in the reference). Using the computed data for the resistance R(f) and Equation 4 the A-weighted noise level can readily be computed as LW = 18.7 dB(A). This value is very close to the other reported values. It should be noted that no assumptions have been made in the simulation results, whereas several of the reported values are based on analytical models that do not capture all details of the physics, for example, the low frequency transition to isothermal behavior.
Finally, the mechanical-thermal noise spectral density curves are depicted in Figure 8 as a power spectral density (top left), a pressure spectral density (top right), and the equivalent noise floor sound pressure level (bottom).
Figure 7: (left) Total, thermal, and viscous dissipated power, and (right) equivalent acoustic resistance computed directly and through the dissipated power.
Figure 8: The computed noise spectral density depicted as the power (top left), pressure (top right), and the level (bottom).
References
1. Brüel & Kjær, “Condenser Microphones and Microphone Preamplifiers for Acoustic Measurements,” Data Handbook be0089, 1982.
2. Brüel & Kjær, Microphone Handbook, vol. 1: Theory, Technical Documentation be1447, 1996.
3. D. Homentcovschi and R. N. Miles, An analytical-numerical method for determining the mechanical response of a condenser microphone,” J. Acoust. Soc. Am., vol. 130, pp. 3698, 2011.
4. T. Lavergne, S. Durand, M. Bruneau, N. Joly, and D. Rodrigues, Dynamic behavior of the circular membrane of an electrostatic microphone: Effect of holes in the backing electrode,” J. Acoust. Soc. Am., vol. 128, pp. 3459, 2010.
5. A.J. Zuckerwar, “Theoretical response of condenser microphones,” J. Acoust. Soc. Am., vol. 64, p. 1278, 1978.
6. B. Russo, “Thermal Noise in Condenser Microphone Back volumes,” Master Thesis, Pen. State University, 2013.
7. J. Esteves, L. Rufer, D. Ekeom, and S. Basrour, “Lumped-parameters equivalent circuit for condenser microphones modeling,” J. Acoust. Soc. Am., vol. 142, p. 2121, 2017.
8. C. W. Tan and J. Miao, “Modified Škvor/Starr approach in the mechanical-thermal noise analysis of condenser microphone,” J. Acoust. Soc. Am., vol. 126, p. 2301, 2009.
9. A. J. Zuckerwar and K. C. T. Ngo, “Measured 1/f noise in the membrane motion of condenser microphones,” J. Acoust. Soc. Am., vol. 95, p. 1419, 1994.
Application Library path: Acoustics_Module/Electroacoustic_Transducers/bk_4134_microphone
Modeling Instructions
From the File menu, choose New.
New
In the New window, click  Model Wizard.
Model Wizard
1
In the Model Wizard window, click  3D.
2
In the Select Physics tree, select Acoustics>Thermoviscous Acoustics>Thermoviscous Acoustics, Frequency Domain (ta).
3
Click Add.
4
In the Select Physics tree, select Structural Mechanics>Membrane (mbrn).
5
Click Add.
6
In the Displacement field text field, type um.
7
In the Displacement field components table, enter the following settings:
The displacement field of the membrane is (um,vm,wm) while the velocity field in the fluid is (u,v,w).
8
In the Select Physics tree, select AC/DC>Electric Fields and Currents>Electrostatics (es).
9
Click Add.
10
Geometry 1
Skip setting up the study types for now because a couple of manual steps are needed to set up the linear perturbation solver properly.
Import the parameters that define the diaphragm material, static surface charge, and incident and vent pressures as well as some mesh related parameters. The parameters are presented in Table 1.
Global Definitions
Parameters 1
1
In the Model Builder window, under Global Definitions click Parameters 1.
2
In the Settings window for Parameters, locate the Parameters section.
3
Click  Load from File.
4
Import the geometry which represents one 12th of the Brüel and Kjær 4134 microphone, see Figure 3. The geometry is courtesy of Brüel and Kjær.
Geometry 1
Import 1 (imp1)
1
In the Home toolbar, click  Import.
2
In the Settings window for Import, locate the Import section.
3
Click  Browse.
4
5
Click  Import.
Next, add a workplane to partition the geometry to simplify meshing.
Work Plane 1 (wp1)
1
In the Geometry toolbar, click  Work Plane.
2
In the Settings window for Work Plane, locate the Plane Definition section.
3
From the Offset type list, choose Through vertex.
4
Find the Offset vertex subsection. Click to select the  Activate Selection toggle button.
5
On the object imp1, select Point 40 only.
6
Click  Build Selected.
Partition Objects 1 (par1)
1
In the Geometry toolbar, click  Booleans and Partitions and choose Partition Objects.
2
3
In the Settings window for Partition Objects, locate the Partition Objects section.
4
From the Partition with list, choose Work plane.
5
Click  Build Selected.
Work Plane 1 (wp1)
In the Model Builder window, collapse the Component 1 (comp1)>Geometry 1>Work Plane 1 (wp1) node.
Form Union (fin)
1
In the Geometry toolbar, click  Build All.
The geometry should look like the one in the figure below.
Next, add three interpolation functions that represent measurement data of the sensitivity of an actual microphone.
Definitions
Interpolation 1 (int1)
1
In the Home toolbar, click  Functions and choose Local>Interpolation.
2
In the Settings window for Interpolation, locate the Definition section.
3
From the Data source list, choose File.
4
Click  Browse.
5
6
In the Number of arguments text field, type 1.
7
Click  Import.
8
Find the Functions subsection. In the table, enter the following settings:
Add predefined selections of boundaries to use when setting up the rest of the physics in the model. Rename the selections such that they are easy to use.
Membrane
1
In the Definitions toolbar, click  Explicit.
2
In the Settings window for Explicit, locate the Input Entities section.
3
From the Geometric entity level list, choose Boundary.
4
5
In the Label text field, type Membrane.
Symmetry
1
In the Definitions toolbar, click  Explicit.
2
In the Settings window for Explicit, type Symmetry in the Label text field.
3
Locate the Input Entities section. From the Geometric entity level list, choose Boundary.
4
Click the  Wireframe Rendering button in the Graphics toolbar.
Use the wireframe rendering for easier visualization of the selections.
5
6
Click the  Zoom Extents button in the Graphics toolbar.
Pressure Release
1
In the Definitions toolbar, click  Explicit.
2
In the Settings window for Explicit, type Pressure Release in the Label text field.
3
Locate the Input Entities section. From the Geometric entity level list, choose Boundary.
4
Ground
1
In the Definitions toolbar, click  Explicit.
2
In the Settings window for Explicit, type Ground in the Label text field.
3
Locate the Input Entities section. From the Geometric entity level list, choose Boundary.
4
Terminal
1
In the Definitions toolbar, click  Explicit.
2
In the Settings window for Explicit, type Terminal in the Label text field.
3
Locate the Input Entities section. From the Geometric entity level list, choose Boundary.
4
Select air as the material to be used in the model and set up a material with the membrane properties.
Add Material
1
In the Home toolbar, click  Add Material to open the Add Material window.
2
Go to the Add Material window.
3
4
Click Add to Component in the window toolbar.
Materials
Membrane Material
1
In the Model Builder window, under Component 1 (comp1) right-click Materials and choose Blank Material.
2
In the Settings window for Material, type Membrane Material in the Label text field.
3
Locate the Geometric Entity Selection section. From the Geometric entity level list, choose Boundary.
4
From the Selection list, choose Membrane.
5
Locate the Material Contents section. In the table, enter the following settings:
6
In the Home toolbar, click  Add Material to close the Add Material window.
To set up the acoustic model, set the acoustic velocity equal to the deformation of the diaphragm, provide two pressure boundary conditions at the vent (exposed and unexposed), and apply symmetry conditions. When solving the model, only one of the pressure boundary conditions at a time will be active.
Thermoviscous Acoustics, Frequency Domain (ta)
Symmetry 1
1
In the Model Builder window, under Component 1 (comp1) right-click Thermoviscous Acoustics, Frequency Domain (ta) and choose Symmetry.
2
In the Settings window for Symmetry, locate the Boundary Selection section.
3
From the Selection list, choose Symmetry.
Pressure (Adiabatic) 1
1
In the Physics toolbar, click  Boundaries and choose Pressure (Adiabatic).
2
In the Settings window for Pressure (Adiabatic), locate the Boundary Selection section.
3
From the Selection list, choose Pressure Release.
4
Locate the Pressure section. In the pbnd text field, type linper(pvent_e*exp(-ta.iomega*Hmic/343[m/s])).
See the expression for the vent pressure given in Equation 7.
Pressure (Adiabatic) 2
1
In the Physics toolbar, click  Boundaries and choose Pressure (Adiabatic).
2
In the Settings window for Pressure (Adiabatic), locate the Boundary Selection section.
3
From the Selection list, choose Pressure Release.
4
Locate the Pressure section. In the pbnd text field, type linper(pvent_u).
The linper() operator is used to indicate load terms that should only be included when solving the linear perturbation part of the model, that, is the frequency-dependent terms. For more information look under Help > Documentation and search for Special Operators.
Model the diaphragm using the Membrane interface. Constrain the membrane at the outer ridge, add an initial stress equal to the membrane tension Tm0, and set up zero displacement in the horizontal plane on the symmetry edges. Finally, add the forces/loads that act on the membrane, that is, the incident pressure field Pin and the electrostatic forces given by the Maxwell stress tensor components (es.dnTex,es.dnTey,es.dnTez).
Membrane (mbrn)
1
In the Model Builder window, under Component 1 (comp1) click Membrane (mbrn).
2
In the Settings window for Membrane, locate the Boundary Selection section.
3
From the Selection list, choose Membrane.
Thickness and Offset 1
1
In the Model Builder window, under Component 1 (comp1)>Membrane (mbrn) click Thickness and Offset 1.
2
In the Settings window for Thickness and Offset, locate the Thickness and Offset section.
3
In the d text field, type tm.
Linear Elastic Material 1
In the Model Builder window, click Linear Elastic Material 1.
Initial Stress and Strain 1
1
In the Physics toolbar, click  Attributes and choose Initial Stress and Strain.
2
In the Settings window for Initial Stress and Strain, locate the Initial Stress and Strain section.
3
In the N0 table, enter the following settings:
Fixed Constraint 1
1
In the Physics toolbar, click  Edges and choose Fixed Constraint.
2
Symmetry 1
1
In the Physics toolbar, click  Edges and choose Symmetry.
2
Face Load 1
1
In the Physics toolbar, click  Boundaries and choose Face Load.
2
In the Settings window for Face Load, locate the Boundary Selection section.
3
From the Selection list, choose Membrane.
4
Locate the Force section. From the Load type list, choose Pressure.
5
In the p text field, type linper(pin).
Face Load 2
1
In the Physics toolbar, click  Boundaries and choose Face Load.
2
In the Settings window for Face Load, locate the Boundary Selection section.
3
From the Selection list, choose Membrane.
Proceed to set up the Electrostatics interface. Add a ground boundary, a terminal boundary with a constant charge Q0, and the Force Calculation that will announce the electrostatic forces. Once added, the forces can be selected in the Face Load feature.
Electrostatics (es)
In the Model Builder window, under Component 1 (comp1) click Electrostatics (es).
Ground 1
1
In the Physics toolbar, click  Boundaries and choose Ground.
2
In the Settings window for Ground, locate the Boundary Selection section.
3
From the Selection list, choose Ground.
Terminal 1
1
In the Physics toolbar, click  Boundaries and choose Terminal.
2
In the Settings window for Terminal, locate the Boundary Selection section.
3
From the Selection list, choose Terminal.
4
Locate the Terminal section. In the Q0 text field, type Q0.
Finally, add the Force Calculation feature that will announce the electrostatic forces used in the Membrane physics.
Force Calculation 1
1
In the Physics toolbar, click  Domains and choose Force Calculation.
2
Go back to the Face Load feature and select the Maxwell surface stress tensor as the applied force.
Membrane (mbrn)
Face Load 2
1
In the Model Builder window, under Component 1 (comp1)>Membrane (mbrn) click Face Load 2.
2
In the Settings window for Face Load, locate the Force section.
3
From the FA list, choose Maxwell surface stress tensor (es/fcal1).
Set up the Moving Mesh feature. This feature allows for a precise calculation of the stationary shape of the membrane, the electric field, and forces. Set a Symmetry condition on the symmetry boundaries. The deformation of the (adjacent) membrane is automatically used as the mesh movement on the boundary.
Component 1 (comp1)
Deforming Domain 1
1
In the Definitions toolbar, click  Moving Mesh and choose Domains>Deforming Domain.
2
Fixed Boundary 1
1
In the Definitions toolbar, click  Moving Mesh and choose Boundaries>Fixed Boundary.
2
Symmetry/Roller 1
1
In the Definitions toolbar, click  Moving Mesh and choose Boundaries>Symmetry/Roller.
2
In the Settings window for Symmetry/Roller, locate the Boundary Selection section.
3
From the Selection list, choose Symmetry.
Finally, proceed with coupling the membrane to the acoustics using the predefined multiphysics coupling.
Multiphysics
Thermoviscous Acoustic-Structure Boundary 1 (tsb1)
1
In the Physics toolbar, click  Multiphysics Couplings and choose Boundary>Thermoviscous Acoustic-Structure Boundary.
2
In the Settings window for Thermoviscous Acoustic-Structure Boundary, locate the Boundary Selection section.
3
From the Selection list, choose Membrane.
You have now defined all the physics, multiphysics, and boundary conditions of the model. Proceed with defining the computational mesh. Because the model is large and the mesh has to be used for a wide frequency range, some compromise is needed. The mesh has to resolve the acoustic boundary layer for all frequencies, here we will create a mesh that is good in most cases. While setting up the mesh, it can be a good idea to switch to Wireframe Rendering rendering. As the mesh is set up manually, proceed by directly adding the first mesh component.
Mesh 1
Mapped 1
1
In the Mesh toolbar, click  Boundary and choose Mapped.
2
Distribution 1
1
Right-click Mapped 1 and choose Distribution.
2
Mesh 1
Free Triangular 1
1
In the Model Builder window, expand the Results node.
2
Right-click Component 1 (comp1)>Mesh 1 and choose Boundary Generators>Free Triangular.
3
Size 1
1
Right-click Free Triangular 1 and choose Size.
2
In the Settings window for Size, locate the Element Size section.
3
Click the Custom button.
4
Locate the Element Size Parameters section.
5
Select the Maximum element size check box. In the associated text field, type 0.4[mm].
Size 2
1
In the Model Builder window, right-click Free Triangular 1 and choose Size.
2
In the Settings window for Size, locate the Geometric Entity Selection section.
3
From the Geometric entity level list, choose Edge.
4
5
Locate the Element Size section. Click the Custom button.
6
Locate the Element Size Parameters section.
7
Select the Maximum element size check box. In the associated text field, type 4*dvisc.
8
Click  Build Selected.
9
Click the  Zoom Extents button in the Graphics toolbar.
Swept 1
1
In the Mesh toolbar, click  Swept.
2
In the Settings window for Swept, locate the Domain Selection section.
3
From the Geometric entity level list, choose Domain.
4
Distribution 1
1
Right-click Swept 1 and choose Distribution.
2
In the Settings window for Distribution, locate the Domain Selection section.
3
Click  Clear Selection.
4
5
Locate the Distribution section. In the Number of elements text field, type 3.
Distribution 2
1
In the Model Builder window, right-click Swept 1 and choose Distribution.
2
In the Settings window for Distribution, locate the Domain Selection section.
3
Click  Clear Selection.
4
5
Locate the Distribution section. In the Number of elements text field, type 2.
Distribution 3
1
Right-click Swept 1 and choose Distribution.
2
In the Settings window for Distribution, locate the Domain Selection section.
3
Click  Clear Selection.
4
5
Click  Build Selected.
Free Tetrahedral 1
In the Mesh toolbar, click  Free Tetrahedral.
Size 1
1
Right-click Free Tetrahedral 1 and choose Size.
2
In the Settings window for Size, locate the Element Size section.
3
Click the Custom button.
4
Locate the Element Size Parameters section.
5
Select the Maximum element size check box. In the associated text field, type 0.5[mm].
6
Click  Build Selected.
Boundary Layers 1
1
In the Mesh toolbar, click  Boundary Layers.
2
In the Settings window for Boundary Layers, click to expand the Transition section.
3
Clear the Smooth transition to interior mesh check box.
Boundary Layer Properties
1
In the Model Builder window, click Boundary Layer Properties.
2
3
In the Settings window for Boundary Layer Properties, locate the Layers section.
4
In the Number of layers text field, type 3.
5
From the Thickness specification list, choose All layers.
6
In the Total thickness text field, type pi*dvisc.
7
Click  Build All.
The final mesh should look like that in the figure below.
Add two studies to solve the model: one for the case where the vent is exposed to the incident pressure Pin and another for the case where the vent is unexposed (shielded) from the incident pressure field.
Solve the model using the linear-perturbation solver in the frequency domain. In order for the solver to work, first perform a stationary study to determine the linearization point. This first study deforms the membrane and mesh due to the electrostatic forces (from the DC polarization voltage) and includes the effects of the static membrane tension Tm0. The second study models the acoustic perturbation to the static solution, that is the small-parameter harmonic variations of the acoustic pressure, temperature, and velocity.
Because this is a strongly coupled multiphysics problem, set the stationary solver to fully coupled (in contrast to the default segregated type). The frequency domain solver is fully coupeled, per default, when frequency domain perturbation is used. Also set the solvers to be direct and in the frequency domain step use PARDISO. The model should solve on a computer with 6 GB of RAM or more.
Add Study
1
In the Home toolbar, click  Add Study to open the Add Study window.
2
Go to the Add Study window.
3
Find the Physics interfaces in study subsection. In the table, clear the Solve check box for Thermoviscous Acoustics, Frequency Domain (ta).
4
Find the Studies subsection. In the Select Study tree, select General Studies>Stationary.
5
Click Add Study in the window toolbar.
Study 1 - Vent Exposed
1
In the Model Builder window, click Study 1.
2
In the Settings window for Study, type Study 1 - Vent Exposed in the Label text field.
3
Locate the Study Settings section. Clear the Generate default plots check box.
Frequency Domain Perturbation
1
In the Study toolbar, click  Study Steps and choose Frequency Domain>Frequency Domain Perturbation.
2
In the Settings window for Frequency Domain Perturbation, locate the Study Settings section.
3
In the Frequencies text field, type 10^{range(0,3/10,3)} 10^{range(3.3,1/20,4.3)}.
This will give you 10 frequencies on a logarithmic scale from 1 Hz to 1 kHz and further 20 frequencies from approximately 2 kHz to 20 kHz.
4
Locate the Physics and Variables Selection section. Select the Modify model configuration for study step check box.
5
In the tree, select Component 1 (comp1)>Thermoviscous Acoustics, Frequency Domain (ta)>Pressure (Adiabatic) 2.
6
Solution 1 (sol1)
1
In the Study toolbar, click  Show Default Solver.
2
In the Model Builder window, expand the Solution 1 (sol1) node.
3
In the Model Builder window, expand the Study 1 - Vent Exposed>Solver Configurations>Solution 1 (sol1)>Stationary Solver 1 node.
4
Right-click Study 1 - Vent Exposed>Solver Configurations>Solution 1 (sol1)>Stationary Solver 1 and choose Fully Coupled.
5
Right-click Study 1 - Vent Exposed>Solver Configurations>Solution 1 (sol1)>Stationary Solver 1>Direct and choose Enable.
6
In the Model Builder window, expand the Study 1 - Vent Exposed>Solver Configurations>Solution 1 (sol1)>Stationary Solver 2 node, then click Direct 1.
7
In the Settings window for Direct, locate the General section.
8
From the Solver list, choose PARDISO.
Solve the model for the case where the vent is exposed to the incoming signal Pin. Solving the model for all the desired frequencies may take up to 15 min.
9
In the Study toolbar, click  Compute.
Set up a second study for the unexposed vent case, where Pvent = 0 Pa. The procedure is the same as for setting up the first study. Disable the first pressure boundary condition so that only the unvented case is treated.
Add Study
1
Go to the Add Study window.
2
Find the Physics interfaces in study subsection. In the table, clear the Solve check box for Thermoviscous Acoustics, Frequency Domain (ta).
3
Find the Studies subsection. In the Select Study tree, select General Studies>Stationary.
4
Click Add Study in the window toolbar.
5
In the Study toolbar, click  Add Study to close the Add Study window.
Study 2 - Vent Unexposed
1
In the Model Builder window, click Study 2.
2
In the Settings window for Study, type Study 2 - Vent Unexposed in the Label text field.
3
Locate the Study Settings section. Clear the Generate default plots check box.
Frequency Domain Perturbation
1
In the Study toolbar, click  Study Steps and choose Frequency Domain>Frequency Domain Perturbation.
2
In the Settings window for Frequency Domain Perturbation, locate the Study Settings section.
3
In the Frequencies text field, type 10^{range(0,3/10,3)} 10^{range(3.3,1/20,4.3)}.
This gives 10 frequencies on a logarithmic scale from 1 Hz to 1 kHz.
4
Locate the Physics and Variables Selection section. Select the Modify model configuration for study step check box.
5
In the tree, select Component 1 (comp1)>Thermoviscous Acoustics, Frequency Domain (ta)>Pressure (Adiabatic) 1.
6
Solution 3 (sol3)
1
In the Study toolbar, click  Show Default Solver.
2
In the Model Builder window, expand the Solution 3 (sol3) node.
3
In the Model Builder window, expand the Study 2 - Vent Unexposed>Solver Configurations>Solution 3 (sol3)>Stationary Solver 1 node.
4
Right-click Study 2 - Vent Unexposed>Solver Configurations>Solution 3 (sol3)>Stationary Solver 1 and choose Fully Coupled.
5
Right-click Study 2 - Vent Unexposed>Solver Configurations>Solution 3 (sol3)>Stationary Solver 1>Direct and choose Enable.
6
In the Model Builder window, expand the Study 2 - Vent Unexposed>Solver Configurations>Solution 3 (sol3)>Stationary Solver 2 node, then click Direct 1.
7
In the Settings window for Direct, locate the General section.
8
From the Solver list, choose PARDISO.
Solve the model for the case where the vent is unexposed to the incoming signal Pin.
9
In the Study toolbar, click  Compute.
Results
Four datasets have been created automatically:
Create a Sector 3D dataset to visualize the full geometry.
Study 1 - Vent Exposed/Solution 1 (sol1)
1
In the Model Builder window, expand the Results>Datasets node, then click Study 1 - Vent Exposed/Solution 1 (sol1).
2
In the Settings window for Solution, locate the Solution section.
3
From the Frame list, choose Material  (X, Y, Z).
Sector 3D 1
1
In the Results toolbar, click  More Datasets and choose Sector 3D.
2
In the Settings window for Sector 3D, locate the Symmetry section.
3
In the Number of sectors text field, type 12.
4
From the Transformation list, choose Rotation and reflection.
5
Find the Radial direction of reflection plane subsection. In the X text field, type 0.
6
In the Y text field, type -1.
Evaluate the stationary terminal voltage to see if it is equal to the polarization voltage Vpol = 200 V as expected.
Global Evaluation 1
1
In the Results toolbar, click  Global Evaluation.
2
In the Settings window for Global Evaluation, click Replace Expression in the upper-right corner of the Expressions section. From the menu, choose Component 1 (comp1)>Electrostatics>Terminals>es.V0_1 - Terminal voltage - V.
3
Locate the Expressions section. From the Expression evaluated for list, choose Static solution.
4
Click  Evaluate.
Next, set up 3D plots to visualize the solution in the computational domain, including membrane deformation, particle velocity, sound pressure levels, acoustic temperature variations, and the static electric potential.
Membrane Deformation
1
In the Results toolbar, click  3D Plot Group.
2
In the Settings window for 3D Plot Group, type Membrane Deformation in the Label text field.
3
Locate the Data section. From the Dataset list, choose Sector 3D 1.
4
Locate the Color Legend section. Select the Show units check box.
Surface 1
1
Right-click Membrane Deformation and choose Surface.
2
In the Settings window for Surface, locate the Expression section.
3
In the Expression text field, type mbrn.disp.
4
From the Unit list, choose µm.
Deformation 1
1
Right-click Surface 1 and choose Deformation.
2
In the Membrane Deformation toolbar, click  Plot.
3
Click the  Zoom Extents button in the Graphics toolbar.
Membrane Deformation
The plot should look like the one in Figure 5 top.
Change the evaluation frequency to 1000 Hz.
1
In the Model Builder window, under Results click Membrane Deformation.
2
In the Settings window for 3D Plot Group, locate the Data section.
3
From the Parameter value (freq (Hz)) list, choose 1000.
4
In the Membrane Deformation toolbar, click  Plot.
The plot should look like the one in Figure 5 bottom.
Velocity
1
In the Home toolbar, click  Add Plot Group and choose 3D Plot Group.
2
In the Settings window for 3D Plot Group, type Velocity in the Label text field.
3
Locate the Color Legend section. Select the Show units check box.
Slice 1
1
Right-click Velocity and choose Slice.
2
In the Settings window for Slice, locate the Expression section.
3
In the Expression text field, type ta.v_inst.
4
Locate the Plane Data section. From the Plane list, choose ZX-planes.
5
In the Velocity toolbar, click  Plot.
The plot shows the instantaneous velocity amplitude. Possibly zoom to the area near the backplate perforation and the membrane to see the highest amplitudes.
Sound Pressure Level
1
In the Home toolbar, click  Add Plot Group and choose 3D Plot Group.
2
In the Settings window for 3D Plot Group, type Sound Pressure Level in the Label text field.
3
Locate the Color Legend section. Select the Show units check box.
Surface 1
1
Right-click Sound Pressure Level and choose Surface.
2
In the Settings window for Surface, locate the Expression section.
3
In the Expression text field, type ta.Lp_t.
4
In the Sound Pressure Level toolbar, click  Plot.
The sound pressure level distribution inside the microphone is seen here.
Acoustic Temperature Variation
1
In the Home toolbar, click  Add Plot Group and choose 3D Plot Group.
2
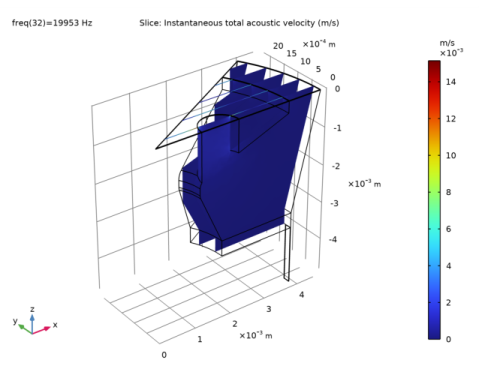
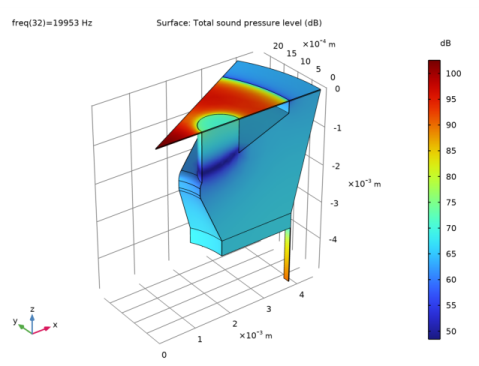
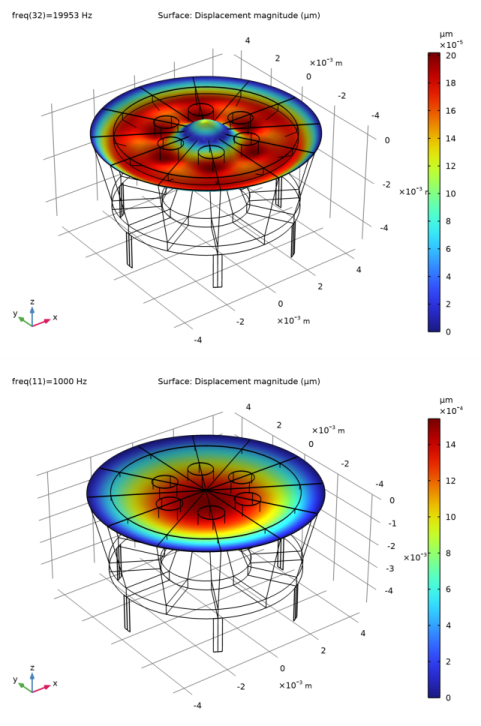
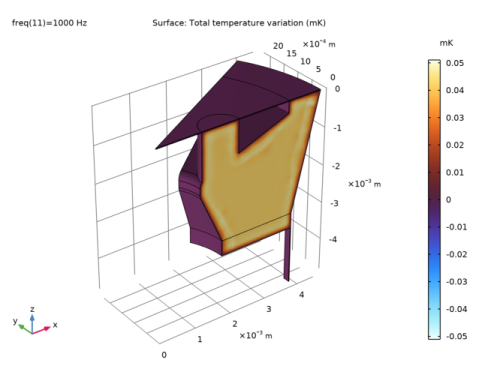
In the Settings window for 3D Plot Group, type Acoustic Temperature Variation in the Label text field.
3
Locate the Data section. From the Parameter value (freq (Hz)) list, choose 1000.
4
Locate the Color Legend section. Select the Show units check box.
Surface 1
1
Right-click Acoustic Temperature Variation and choose Surface.
2
In the Settings window for Surface, locate the Expression section.
3
In the Expression text field, type ta.T_t.
4
From the Unit list, choose mK.
5
Locate the Coloring and Style section. From the Color table list, choose ThermalWave.
6
From the Scale list, choose Linear symmetric.
7
In the Acoustic Temperature Variation toolbar, click  Plot.
The acoustic temperature variation ta.T_t inside the microphone is here seen at 1000 Hz. The thermal boundary layer is clearly visible. If you change the evaluation frequency to a lower value you can study the transition to the isothermal behavior. Here T is nearly constant and 0 inside the microphone (note the min/max numerical values on the color bar).
Electric Potential (stationary)
1
In the Home toolbar, click  Add Plot Group and choose 3D Plot Group.
2
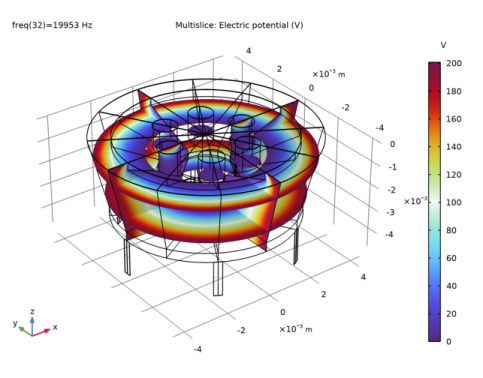
In the Settings window for 3D Plot Group, type Electric Potential (stationary) in the Label text field.
3
Locate the Data section. From the Dataset list, choose Sector 3D 1.
4
Locate the Color Legend section. Select the Show units check box.
Multislice 1
1
In the Electric Potential (stationary) toolbar, click  More Plots and choose Multislice.
2
In the Settings window for Multislice, locate the Expression section.
3
In the Expression text field, type V.
4
From the Expression evaluated for list, choose Static solution.
5
Locate the Multiplane Data section. Find the Z-planes subsection. In the Planes text field, type 3.
6
Locate the Coloring and Style section. From the Color table list, choose Dipole.
7
In the Electric Potential (stationary) toolbar, click  Plot.
The plot should look like the one in Figure 6.
Now, create three 1D plots to visualize the microphone sensitivity, membrane deformation, and Maxwell stresses.
Sensitivity
1
In the Home toolbar, click  Add Plot Group and choose 1D Plot Group.
2
In the Settings window for 1D Plot Group, type Sensitivity in the Label text field.
3
Click to expand the Title section. From the Title type list, choose Label.
4
Locate the Plot Settings section.
5
Select the x-axis label check box. In the associated text field, type f (Hz).
6
Select the y-axis label check box. In the associated text field, type dB (rel. 1 V/Pa).
7
Locate the Legend section. From the Position list, choose Lower right.
Global 1
1
Right-click Sensitivity and choose Global.
2
In the Settings window for Global, locate the y-Axis Data section.
3
4
In the Sensitivity toolbar, click  Plot.
5
Click the  x-Axis Log Scale button in the Graphics toolbar.
Global 2
1
In the Model Builder window, right-click Sensitivity and choose Global.
2
In the Settings window for Global, locate the Data section.
3
From the Dataset list, choose Study 2 - Vent Unexposed/Solution 3 (sol3).
4
Locate the y-Axis Data section. In the table, enter the following settings:
5
In the Sensitivity toolbar, click  Plot.
The plot of the microphone sensitivity should look like the one in Figure 4.
Static Membrane Deformation
1
In the Home toolbar, click  Add Plot Group and choose 1D Plot Group.
2
In the Settings window for 1D Plot Group, type Static Membrane Deformation in the Label text field.
3
Locate the Title section. From the Title type list, choose Label.
Line Graph 1
1
Right-click Static Membrane Deformation and choose Line Graph.
2
In the Settings window for Line Graph, locate the y-Axis Data section.
3
In the Expression text field, type wm.
4
5
From the Expression evaluated for list, choose Static solution.
Line Graph 2
1
In the Model Builder window, right-click Static Membrane Deformation and choose Line Graph.
2
In the Settings window for Line Graph, locate the y-Axis Data section.
3
In the Expression text field, type wm.
4
5
From the Expression evaluated for list, choose Static solution.
6
In the Static Membrane Deformation toolbar, click  Plot.
The figure below shows the static deformation of the membrane due to the pre-polarization, plotted along the two symmetry boundaries. Note the small difference in the curves due to the presence of the hole in the backplate.
Maxwell Stress
1
Right-click Static Membrane Deformation and choose Duplicate.
2
In the Settings window for 1D Plot Group, type Maxwell Stress in the Label text field.
Line Graph 1
1
In the Model Builder window, expand the Maxwell Stress node, then click Line Graph 1.
2
In the Settings window for Line Graph, locate the y-Axis Data section.
3
In the Expression text field, type es.dnTz.
Line Graph 2
1
In the Model Builder window, click Line Graph 2.
2
In the Settings window for Line Graph, locate the y-Axis Data section.
3
In the Expression text field, type es.dnTz.
4
In the Maxwell Stress toolbar, click  Plot.
This figure depicts the static electric surface forces (Maxwell stresses) acting on the membrane due to the pre-polarization. Again notice the difference in the two curves, which is due to the presence of the hole in the backplate.
Finally, reproduce the sensitivity curve in 1/3 octave bands (in the exposed vent configuration) using the Octave Band plot.
Sensitivity, 1/3 Octave Bands
1
In the Home toolbar, click  Add Plot Group and choose 1D Plot Group.
2
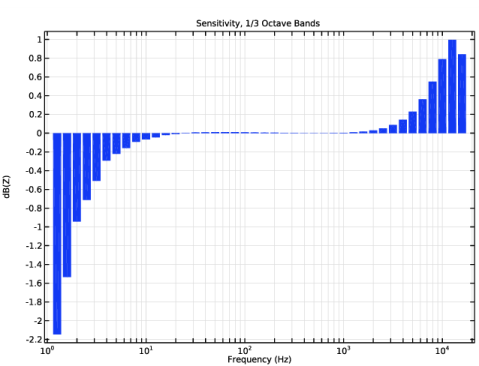
In the Settings window for 1D Plot Group, type Sensitivity, 1/3 Octave Bands in the Label text field.
3
Locate the Title section. From the Title type list, choose Label.
Octave Band 1
1
In the Sensitivity, 1/3 Octave Bands toolbar, click  More Plots and choose Octave Band.
2
In the Settings window for Octave Band, locate the Selection section.
3
From the Geometric entity level list, choose Global.
4
Locate the y-Axis Data section. From the Expression type list, choose Transfer function.
5
In the Level reference text field, type L0.
6
In the Expression text field, type abs(es.V0_1/pin)^2.
The expression represents the power transfer function H from the incident pressure to measured voltage.
7
Locate the Plot section. From the Quantity list, choose Band average power spectral density.
8
From the Band type list, choose 1/3 octave.
9
In the Sensitivity, 1/3 Octave Bands toolbar, click  Plot.
Definitions
Now, proceed and postprocess the mechanical-thermal noise of the microphone. First, load some variables and set up two integration operators. The plots and a discussion of the results are presented at the end of the Results and Discussion section.
Integration 1 (intop1)
1
In the Definitions toolbar, click  Nonlocal Couplings and choose Integration.
2
In the Settings window for Integration, type intop_vol in the Operator name text field.
3
Locate the Source Selection section. From the Selection list, choose All domains.
Integration 2 (intop2)
1
In the Definitions toolbar, click  Nonlocal Couplings and choose Integration.
2
In the Settings window for Integration, type intop_mem in the Operator name text field.
3
Locate the Source Selection section. From the Geometric entity level list, choose Boundary.
4
From the Selection list, choose Membrane.
Variables 1
1
In the Model Builder window, right-click Definitions and choose Variables.
2
In the Settings window for Variables, locate the Variables section.
3
Click  Load from File.
4
Study 2 - Vent Unexposed
Update the solution in Study 2 so that the new variables and integration operators are present for postprocessing.
In the Study toolbar, click  Update Solution.
Results
Dissipated Energy
1
In the Home toolbar, click  Add Plot Group and choose 1D Plot Group.
2
In the Settings window for 1D Plot Group, type Dissipated Energy in the Label text field.
3
Locate the Data section. From the Dataset list, choose Study 2 - Vent Unexposed/Solution 3 (sol3).
4
Locate the Title section. From the Title type list, choose Label.
5
Locate the Plot Settings section.
6
Select the x-axis label check box. In the associated text field, type f (Hz).
7
Select the y-axis label check box. In the associated text field, type P (W).
8
Locate the Axis section. Select the x-axis log scale check box.
9
Select the y-axis log scale check box.
10
Locate the Legend section. From the Position list, choose Upper left.
Global 1
1
Right-click Dissipated Energy and choose Global.
2
In the Settings window for Global, locate the y-Axis Data section.
3
4
In the Dissipated Energy toolbar, click  Plot.
Equivalent Acoustic Resistance
1
In the Home toolbar, click  Add Plot Group and choose 1D Plot Group.
2
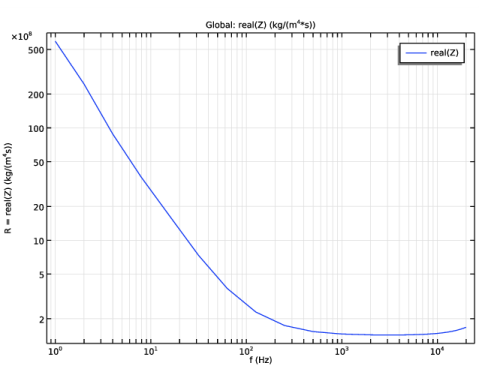
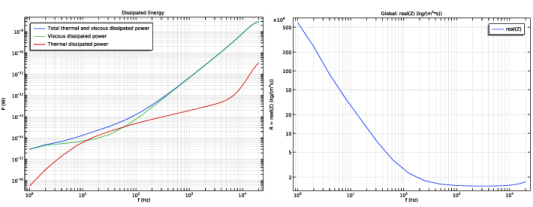
In the Settings window for 1D Plot Group, type Equivalent Acoustic Resistance in the Label text field.
3
Locate the Data section. From the Dataset list, choose Study 2 - Vent Unexposed/Solution 3 (sol3).
4
Locate the Plot Settings section.
5
Select the x-axis label check box. In the associated text field, type f (Hz).
6
Select the y-axis label check box. In the associated text field, type R = real(Z) (kg/(m<sup>4</sup>s)).
7
Locate the Axis section. Select the x-axis log scale check box.
8
Select the y-axis log scale check box.
Global 1
1
Right-click Equivalent Acoustic Resistance and choose Global.
2
In the Settings window for Global, locate the y-Axis Data section.
3
Global 2
1
In the Model Builder window, right-click Equivalent Acoustic Resistance and choose Global.
2
In the Settings window for Global, locate the y-Axis Data section.
3
4
Click to expand the Coloring and Style section. Find the Line style subsection. From the Line list, choose None.
5
Find the Line markers subsection. From the Marker list, choose Point.
6
From the Positioning list, choose In data points.
7
In the Equivalent Acoustic Resistance toolbar, click  Plot.
Noise Power Spectral Density
1
In the Home toolbar, click  Add Plot Group and choose 1D Plot Group.
2
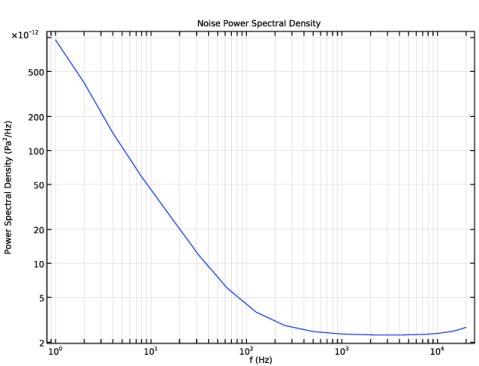
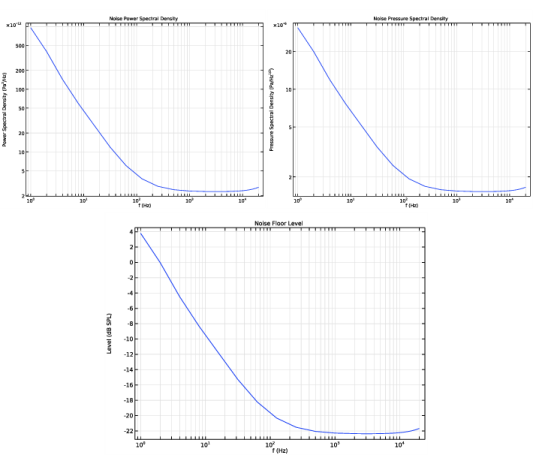
In the Settings window for 1D Plot Group, type Noise Power Spectral Density in the Label text field.
3
Locate the Data section. From the Dataset list, choose Study 2 - Vent Unexposed/Solution 3 (sol3).
4
Locate the Title section. From the Title type list, choose Label.
5
Locate the Plot Settings section.
6
Select the x-axis label check box. In the associated text field, type f (Hz).
7
Select the y-axis label check box. In the associated text field, type Power Spectral Density (Pa<sup>2</sup>/Hz).
8
Locate the Axis section. Select the x-axis log scale check box.
9
Select the y-axis log scale check box.
10
Locate the Legend section. Clear the Show legends check box.
Global 1
1
Right-click Noise Power Spectral Density and choose Global.
2
In the Settings window for Global, locate the y-Axis Data section.
3
4
In the Noise Power Spectral Density toolbar, click  Plot.
Noise Pressure Spectral Density
1
In the Home toolbar, click  Add Plot Group and choose 1D Plot Group.
2
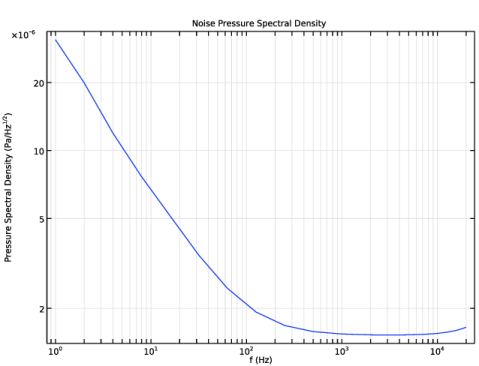
In the Settings window for 1D Plot Group, type Noise Pressure Spectral Density in the Label text field.
3
Locate the Data section. From the Dataset list, choose Study 2 - Vent Unexposed/Solution 3 (sol3).
4
Locate the Title section. From the Title type list, choose Label.
5
Locate the Plot Settings section.
6
Select the x-axis label check box. In the associated text field, type f (Hz).
7
Select the y-axis label check box. In the associated text field, type Pressure Spectral Density (Pa/Hz<sup>1/2</sup>).
8
Locate the Axis section. Select the x-axis log scale check box.
9
Select the y-axis log scale check box.
10
Locate the Legend section. Clear the Show legends check box.
Global 1
1
Right-click Noise Pressure Spectral Density and choose Global.
2
In the Settings window for Global, locate the y-Axis Data section.
3
4
In the Noise Pressure Spectral Density toolbar, click  Plot.
Noise Floor Level
1
In the Home toolbar, click  Add Plot Group and choose 1D Plot Group.
2
In the Settings window for 1D Plot Group, type Noise Floor Level in the Label text field.
3
Locate the Data section. From the Dataset list, choose Study 2 - Vent Unexposed/Solution 3 (sol3).
4
Locate the Title section. From the Title type list, choose Label.
5
Locate the Plot Settings section.
6
Select the x-axis label check box. In the associated text field, type f (Hz).
7
Select the y-axis label check box. In the associated text field, type Level (dB SPL).
8
Locate the Axis section. Select the x-axis log scale check box.
9
Locate the Legend section. Clear the Show legends check box.
Global 1
1
Right-click Noise Floor Level and choose Global.
2
In the Settings window for Global, locate the y-Axis Data section.
3
4
In the Noise Floor Level toolbar, click  Plot.
Dissipated Energy, Equivalent Acoustic Resistance, Noise Floor Level, Noise Power Spectral Density, Noise Pressure Spectral Density
1
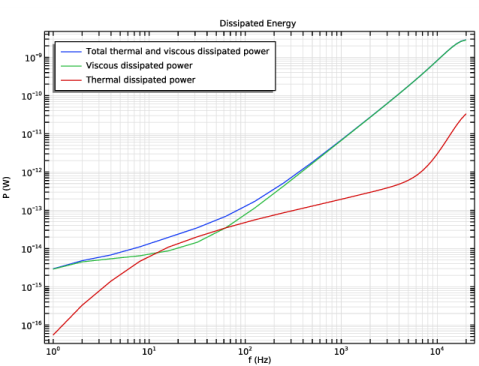
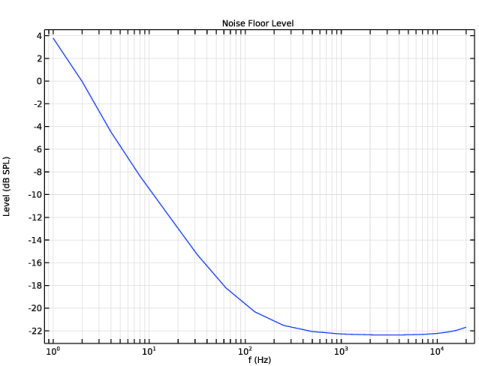
In the Model Builder window, under Results, Ctrl-click to select Dissipated Energy, Equivalent Acoustic Resistance, Noise Power Spectral Density, Noise Pressure Spectral Density, and Noise Floor Level.
2
Mechanical-Thermal Noise Plots
In the Settings window for Group, type Mechanical-Thermal Noise Plots in the Label text field.