The Spot Welds node in the Shell interface is intended for global analysis of structures connected with a large number of spot welds. The details of the spot weld as such is not modeled. An elastic connection is established between the two shell faces.
The location of the welds is given in a table in the Nugget Location section. In most cases, you will import this table from an separate text file using
Load from file (

).
Any line that starts with a hash sign (#) is treated as comment and is ignored.
The default is to compute the stiffness using the properties of a thin layer. The thickness of the layer is a user input, named Cohesive thickness. The stiffness of the weld is inversely proportional to this value. Physically, the cohesive thickness can be seen as representing the part of the nugget that is located between the two plates. This is, however, not the full truth, since the local stress and strain field around a real spot weld is complex. Even an ideal weld, where there is no distance between the plates, will have some flexibility.
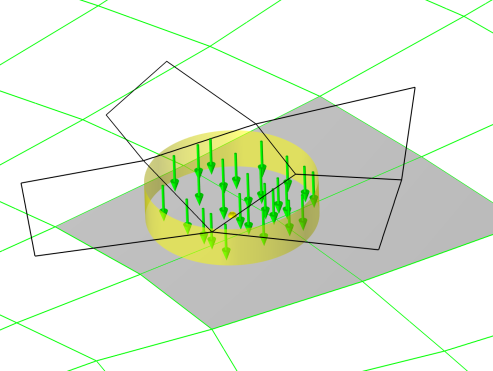
Figure 2-39 shows conceptually how two boundaries are connected by a spot weld.
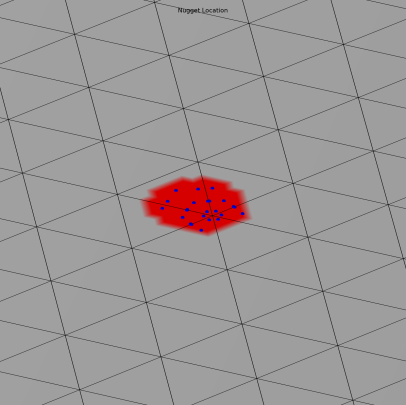
You can check the interpretation of the connection by adding a Nugget Location plot from
Result Templates. as shown in
Figure 2-40. In this plot, each nugget is indicated using a red color. Also, each integration point that contributes to the nugget stiffness and force calculation is shown in blue.
If you want to investigate the distribution of integration points using another integration scheme, you can modify the Gauss-point order setting in the
Evaluation section in the settings for the
Point 1 plot in the
Nugget Location plot group.