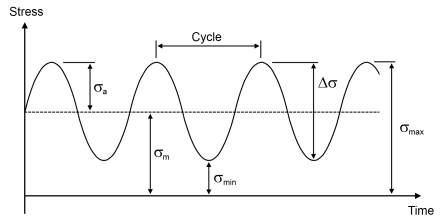
The most common fatigue test is where the loading is fully reversed. The mean stress is then zero and R =
−1. The second fundamental test is the pulsating test, where the load varies between zero and a maximum value, giving
R =
0.
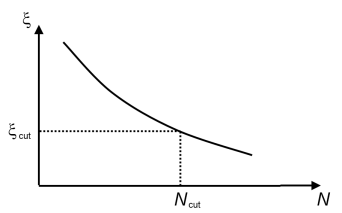
One of the simplest methods for fatigue evaluation is a relation between a fatigue controlling quantity, ξ, and the fatigue life,
N, see
Figure 3-4. This relation is the fatigue life curve. In most applications the fatigue controlling quantity is a stress amplitude or a strain amplitude.
In COMSOL the fatigue life curve is used in the following models: Stress Life Models,
Strain Life Models,
Strain Based Fatigue Models,
Cumulative Damage Model, and
Harmonic Vibration Model. The fatigue life curve goes asymptotically toward infinite life for low values of the fatigue controlling quantity. The objective of a fatigue analysis is to find the critical life that is found for the largest value of the fatigue controlling quantity. Since the spread in the results can be very large, a cycle cutoff,
Ncut, controls how far on the life curve results are evaluated. When the fatigue controlling quantity is low,
ξ < ξcut, the fatigue life is set to the cycle cutoff,
N = Ncut.