PDF

Orbit Calculation
Introduction
This model is a first introduction to defining and verifying a satellite orbit, and computing the solar, albedo, and Earth infrared thermal loads.
A 1U CubeSat is in a circular orbit at 400 km altitude, inclination of 50°, and longitude of ascending node of 0°. The satellite is rotating slowly about its nadir-pointing axis.
This type of analysis is usually performed prior to computing the temperature evolution within the structure of the satellite. The model Spacecraft Thermal Analysis shows the workflow for computing the satellite temperature on multiple orbit periods.
Model Definition
For the purposes of a quick preliminary computation of the orbital heat loads, it is sufficient to use a geometry that describes the outside envelope of a 1U CubeSat satellite with a protruding sensor. A cube of 10 cm side length is used with a 2 cm radius cylinder protruding 2 cm from the center of one side.
The two-band solar and ambient radiation model is used, with the separation point of 2.5 μm between the spectral bands. The sides of the satellite have solar cells mounted on them, which have high absorptivity in all bands. All other surfaces have the same emissivity of 0.2 in the solar band and 0.85 in the ambient band. For surfaces of a temperature less than 573.15 K (300°C), 99% of all emitted radiation will be in the ambient band, while 97% of the solar and albedo irradiation will be in the solar band.
The solar loads are evaluated at the point where Earth is at perihelion, the winter solstice. The Sun is treated as an infinitely faraway ideal blackbody emitter with fixed intensity of 1414 W/m2 over the entire orbit, as long as the satellite is not in eclipse. The proportion of solar radiation incident onto Earth reflected diffusely back towards the satellite, or albedo, is set to 0.3 everywhere on the planet. Earth is relatively warm compared to background deep space and is modeled as a distributed emitter having a uniform flux of 225 W/m2.
The orientation of the satellite is such that the +Z direction, in the geometry coordinate system, points towards Earth. The satellite is slowly rotating about this primary axis, so the secondary axis can be any vector that is not parallel to nadir, in this case the vector parallel to the velocity direction is used.
Results and Discussion
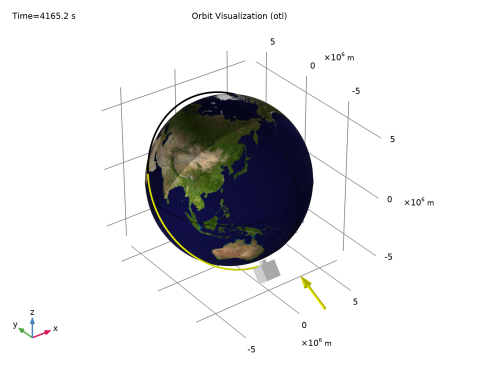
Figure 1 shows the satellite in orbit around Earth. The yellow arrow represents the Sun vector. The orbit line is colored black or yellow depending on whether the satellite is in eclipse or not. Use this plot to verify that the sensor is facing Earth at all times.
Figure 1: Satellite orbit around Earth after 4165 s1.
Figure 2 shows the external irradiation and the Sun and nadir vector, respectively, in yellow and blue. Again, the path of the Sun vector around the satellite is colored black or yellow depending on whether the satellite is in eclipse or not. Observe the partial shading around the sensor.
Figure 2: External irradiation after 3165 s.
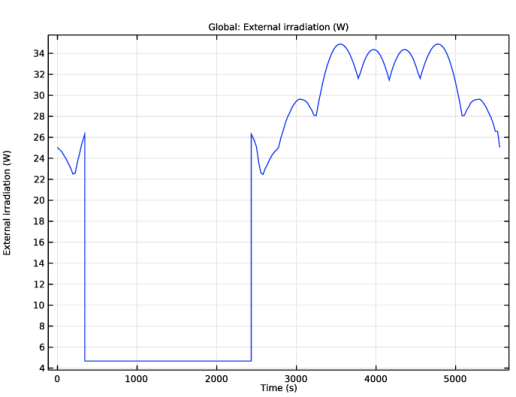
Figure 3 shows the external irradiation over time. When the satellite is in eclipse, the irradiation is only due to Earth’s infrared flux.
Figure 3: External irradiation over time.
The average of the total environmental irradiation over the entire orbit is 20.5 W. This satellite has very few exterior surfaces that shadow and face each other. That is, its exterior is very nearly convex, so the total environmental loads are reasonably well estimated from the irradiation.
Application Library path: Heat_Transfer_Module/Orbital_Thermal_Loads/orbit_calculation
Model Instructions
From the File menu, choose New.
New
In the New window, click  Model Wizard.
Model Wizard
1
In the Model Wizard window, click  3D.
2
In the Select Physics tree, select Heat Transfer>Radiation>Orbital Thermal Loads (otl).
3
Click Add.
4
Click  Study.
5
In the Select Study tree, select Preset Studies for Selected Physics Interfaces>Orbit Calculation.
6
Geometry 1
Block 1 (blk1)
1
In the Geometry toolbar, click  Block.
2
In the Settings window for Block, locate the Size and Shape section.
3
In the Width text field, type 10[cm].
4
In the Depth text field, type 10[cm].
5
In the Height text field, type 10[cm].
6
Locate the Position section. From the Base list, choose Center.
Cylinder 1 (cyl1)
1
In the Geometry toolbar, click  Cylinder.
2
In the Settings window for Cylinder, locate the Size and Shape section.
3
In the Radius text field, type 2[cm].
4
In the Height text field, type 2[cm].
5
Locate the Position section. In the z text field, type 5[cm].
Cylinder 2 (cyl2)
1
In the Geometry toolbar, click  Cylinder.
2
In the Settings window for Cylinder, locate the Size and Shape section.
3
In the Radius text field, type 1.8[cm].
4
In the Height text field, type 3[cm].
5
Locate the Position section. In the z text field, type 4.5[cm].
Partition Domains 1 (pard1)
1
In the Geometry toolbar, click  Booleans and Partitions and choose Partition Domains.
2
On the object cyl2, select Domain 1 only.
3
In the Settings window for Partition Domains, locate the Partition Domains section.
4
From the Partition with list, choose Faces.
5
On the object blk1, select Boundary 4 only.
Difference 1 (dif1)
1
In the Geometry toolbar, click  Booleans and Partitions and choose Difference.
2
Select the objects blk1 and cyl1 only.
3
In the Settings window for Difference, locate the Difference section.
4
Find the Objects to subtract subsection. Click to select the  Activate Selection toggle button.
5
6
Clear the Keep interior boundaries check box.
7
Click  Build All Objects.
Orbital Thermal Loads (otl)
Sun Properties 1
By default, the Sun vector and solar flux are set to correspond to the winter solstice.
Planet Properties 1
The Earth properties are used to define the planet.
1
In the Model Builder window, click Planet Properties 1.
2
In the Settings window for Planet Properties, locate the Radiative Properties section.
3
From the Albedo list, choose User defined distribution.
The proportion of solar radiation incident onto Earth reflected diffusely back towards the satellite, or albedo, is set to 0.3 everywhere on the planet.
4
In the α0,λ text field, type 0.3.
Earth is relatively warm compared to background deep space and is modeled as a distributed emitter having a uniform flux of 225 W/m^2.
5
From the Planet infrared flux list, choose User defined for each band.
6
Orbital Parameters 1
A circular orbit is defined at 400 km altitude, inclination of 50°, and longitude of ascending node of 0°.
1
In the Model Builder window, click Orbital Parameters 1.
2
In the Settings window for Orbital Parameters, locate the Orbital Parameters section.
3
From the Orbit type list, choose Circular.
4
In the R text field, type otl.R_planet+400[km].
5
In the i text field, type 50[deg].
Spacecraft Axes 1
By default, the axes of the satellite are defined such that the +Z direction, in the geometry coordinate system, is the primary axis and the +X direction is the secondary axis.
Spacecraft Orientation 1
The orientation of the satellite is such that the primary direction points towards Earth. The satellite is slowly rotating about its primary axis, so the secondary axis can be any vector that is not parallel to nadir. In this case the default setting, of the +X direction corresponding to the direction of travel, is used.
1
In the Model Builder window, click Spacecraft Orientation 1.
2
In the Settings window for Spacecraft Orientation, locate the Spacecraft Orientation section.
3
Find the Rotations subsection. From the Rotation about primary axis list, choose Angular rate.
4
In the ω text field, type 2*360[deg]/otl.T_orbit.
Generate Events Interface 1
In order to handle the passing of the spacecraft through the eclipse, an Events interface is necessary and should always be added when using the Orbital Thermal Loads physics.
1
In the Model Builder window, click Generate Events Interface 1.
2
In the Settings window for Generate Events Interface, locate the Generate Events Interface section.
3
Click Create New.
Diffuse Surface 1
Now, define the radiative properties of the different boundaries.
1
In the Model Builder window, click Diffuse Surface 1.
2
In the Settings window for Diffuse Surface, locate the Surface Emissivity section.
3
From the ε list, choose User defined for each band.
4
Diffuse Surface 2
1
In the Physics toolbar, click  Boundaries and choose Diffuse Surface.
2
In the Settings window for Diffuse Surface, locate the Boundary Selection section.
3
Click  Paste Selection.
4
In the Paste Selection dialog box, type 1 2 5 20 in the Selection text field.
5
6
In the Settings window for Diffuse Surface, locate the Surface Emissivity section.
7
From the ε list, choose User defined for each band.
8
Study 1
In the Home toolbar, click  Compute.
Results
Orbit Visualization (otl)
This default plot is used to check that the orbit parameters, orientation, and events are correctly defined. Since neither the study nor the plot is computationally expensive, it is possible to adjust the model parameters and rerun the study to see the results very quickly.
Add an evaluation group to verify that the configuration is correct by extracting some orbit data.
Orbit Variables
1
In the Results toolbar, click  Evaluation Group.
2
In the Settings window for Evaluation Group, type Orbit Variables in the Label text field.
3
Locate the Data section. From the Time selection list, choose First.
4
Locate the Transformation section. Select the Transpose check box.
5
Click to expand the Format section. From the Include parameters list, choose Off.
Global Evaluation 1
1
Right-click Orbit Variables and choose Global Evaluation.
2
In the Settings window for Global Evaluation, locate the Expressions section.
3
4
In the Orbit Variables toolbar, click  Evaluate.
Once the orbit configuration is correct, an Orbit Thermal Loads study can be added to estimate the external irradiation on the satellite boundaries.
Definitions
An integration operator is added to integrate the external irradiation over the spacecraft boundaries.
Integration 1 (intop1)
1
In the Definitions toolbar, click  Nonlocal Couplings and choose Integration.
2
In the Settings window for Integration, locate the Source Selection section.
3
From the Geometric entity level list, choose Boundary.
4
From the Selection list, choose All boundaries.
Mesh 1
Since this model is only used to evaluate irradiation, a quite coarse mesh is sufficient.
1
In the Model Builder window, under Component 1 (comp1) click Mesh 1.
2
In the Settings window for Mesh, locate the Physics-Controlled Mesh section.
3
From the Element size list, choose Extremely coarse.
Add Study
1
In the Home toolbar, click  Add Study to open the Add Study window.
2
Go to the Add Study window.
3
Find the Studies subsection. In the Select Study tree, select Preset Studies for Selected Physics Interfaces>Orbital Thermal Loads>Orbit Thermal Loads.
4
5
In the Home toolbar, click  Add Study to close the Add Study window.
Study 2
Step 1: Orbit Thermal Loads
1
In the Settings window for Orbit Thermal Loads, locate the Study Settings section.
2
In the Output orbit times text field, type range(0,0.005,1).
3
In the Home toolbar, click  Compute.
Results
External Irradiation (otl)
This plot is used to show the external irradiation over time. The blue arrow shows the nadir direction and the yellow arrow shows the Sun direction.
Set the Line type to Tube to show the path of the Sun around the spacecraft.
Sun Vector
1
In the Model Builder window, expand the External Irradiation (otl) node, then click Sun Vector.
2
In the Settings window for Point Trajectories, locate the Coloring and Style section.
3
Find the Line style subsection. From the Type list, choose Tube.
Plot the evolution of the external irradiation on the satellite boundaries over time (Figure 3).
External Irradiation Over Time
1
In the Home toolbar, click  Add Plot Group and choose 1D Plot Group.
2
In the Settings window for 1D Plot Group, locate the Data section.
3
From the Dataset list, choose Study 2/Solution 2 (sol2).
4
In the Label text field, type External Irradiation Over Time.
Global 1
1
Right-click External Irradiation Over Time and choose Global.
2
In the Settings window for Global, locate the y-Axis Data section.
3
4
Click to expand the Legends section. Clear the Show legends check box.
5
In the External Irradiation Over Time toolbar, click  Plot.
Finally, add an evaluation to get the average of the total environmental irradiation over the entire orbit.
Surface Average 1
1
In the Model Builder window, right-click Orbit Variables and choose Average>Surface Average.
2
In the Settings window for Surface Average, locate the Data section.
3
From the Dataset list, choose Study 2/Solution 2 (sol2).
4
From the Time selection list, choose Last.
5
Locate the Selection section. From the Selection list, choose All boundaries.
6
Locate the Expressions section. In the table, enter the following settings:
7
In the Orbit Variables toolbar, click  Evaluate.
 

1
NASA Goddard Space Flight Center Image by Reto Stöckli (land surface, shallow water, clouds). Enhancements by Robert Simmon (ocean color, compositing, 3D globes, animation). Data and technical support: MODIS Land Group; MODIS Science Data Support Team; MODIS Atmosphere Group; MODIS Ocean Group Additional data: USGS EROS Data Center (topography); USGS Terrestrial Remote Sensing Flagstaff Field Center (Antarctica); Defense Meteorological Satellite Program (city lights).