PDF

Muffler with Perforates
Introduction
The original version of this model was developed by Dr. Sabry Allam and Prof. Mats Åbom at the Marcus Wallenberg Laboratory for Sound and Vibration Research, Royal Institute of Technology, Stockholm, Sweden. Dr. Allam and Prof.  Åbom also provided the experimental data used in the model.
There are two basic types of mufflers:
Reflective (or reactive) mufflers — those that reflect acoustic waves by abrupt area expansions or changes of impedance.
Dissipative mufflers — mufflers based on dissipation of acoustic energy into heat through viscous and thermal losses in fibrous materials or flow-related (resistive) losses in perforated pipes.
Reflective mufflers are best suited for the low frequency range where only plane waves can propagate in the system, while dissipative mufflers with fibers are efficient in the mid-to-high frequency range. Dissipative mufflers based on flow losses, on the other hand, work also at low frequencies. A typical automotive exhaust system is a hybrid construction consisting of a combination of reflective and dissipative muffler elements. The reflective parts are normally tuned to remove dominating low-frequency engine harmonics while the dissipative parts are designed to take care of higher-frequency noise.
In the industry, exhaust systems are typically analyzed with nonlinear 1D gas-dynamics codes. Such codes, however, do not capture 3D acoustic effects such as higher-order duct modes, and the modeling of fibrous materials is not satisfactory. In practice, there is therefore a need to use linear acoustic models of exhaust and intake systems to enable detailed modeling and optimization of the acoustic response, at the cost of neglecting nonlinear effects. The Port boundary conditions enable the analysis of plane waves and higher order modes above their cutoff frequency propagating through the inlet and outlet. In this model, we stay below the cutoff frequency of the first mode and only model the plane wave propagation.
Model Definition
The muffler you analyze here is an example of a complex hybrid muffler in which the dissipative element is created completely by flow through perforated pipes and plates. When designing a model for a muffler without fibrous materials you need to consider the following aspects:
Geometry — The design for this model is based on a modular muffler developed for research purposes. It closely resembles commercially available automotive mufflers, and was used as a test case for muffler modeling in an EC-project (ARTEMIS).
Mean flow distribution — The Mach number in an exhaust system is normally less than 0.3. This means that in mufflers with flow expansions, the average Mach number is quite small (less than 0.1). For such cases, you can neglect the convective flow effects, and the only important effect of the mean flow is its influence on the impedance of perforated pipes/plates. This model treats the case where there is no mean flow in the muffler.
Temperature distribution — In a running engine, the air temperature inside the muffler is typically in the range 300400 °C. There is also a temperature gradient through the muffler. However, the acoustic effect of this gradient is small and the average temperature is normally used to calculate the speed of sound. In this case, the experiments were performed at room temperature (20 °C). The model therefore assumes the temperature in the muffler to be constant and uses the default values for air density and speed of sound at 1 atm and 20 °C.
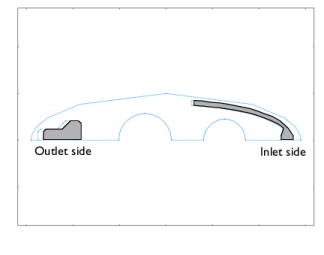
A schematic cross section of the muffler geometry is shown in Figure 1.
Figure 1: Muffler geometry cross section.
The detailed design and dimensions of the outlet pipe and the four baffles (as seen from the right in Figure 1) are given in Figure 2 through Figure 5.
Figure 2: Outlet pipe. A stainless steel sleeve is located above the left perforated section with 288 holes. The other two pipe perforates contain 144 holes each.
Figure 3: Baffle number 1, outlet side to the left and inlet side to the right.
Figure 4: Baffles number 2 and 3.
Figure 5: Baffle number 4.
The model geometry is supplied as a CAD file. To reduce computation time only the upper half of the muffler is included; a symmetry condition is added at  z = 0. (A careful inspection of the drawings in Figure 3Figure 5 shows that the reflection symmetry is not perfect for the perforates on the outlet side. However, the asymmetry is so minor that it is safe to neglect its effects.)
In the CAD geometry, the perforated regions are outlined by edges drawn on the corresponding boundaries. This is illustrated for baffle number 1 in Figure 6 where the perforated regions have been shaded for emphasis.
Figure 6: Perforated regions of baffle number 1.
You model the acoustic effects of the perforates by applying the Acoustics Module’s Interior Perforated Plate boundary condition on these regions. A thorough description of the perforated plate impedance models is available in the section Theory for the Interior Impedance Models in the Acoustics Module User’s Guide. The expression for the transfer impedance Zi of the plate depends on the chosen model type, but is in general a function of the plate geometry, the porosity pattern, the material parameters of the fluid, and the wave number k. The last is given by 2π f/c where f denotes the frequency. You run the simulation for a range of frequencies between 20 Hz and 600 Hz.
The Interior Perforated Plate boundary condition also allows user defined contributions to the impedance. For example, you will specify the additional resistance caused by a mean flow in the muffler to include the effects of the metallic sleeve above pipe perforate number 1. For details about the effect of flow see Ref. 1, Ref. 2, and Ref. 3.
The relevant input parameters for the model are listed in Table 1. The porosity values were obtained by dividing the total area of the holes in each perforate with the area of the corresponding region in the CAD geometry. The resistance of the metallic sleeve was experimentally measured.
tp
dh
σp
σbi
σbo
θsleeve
The parameters related to the material are taken from the surrounding fluid material data.
Results and Discussion
The transmission loss in the muffler is defined as
(1)
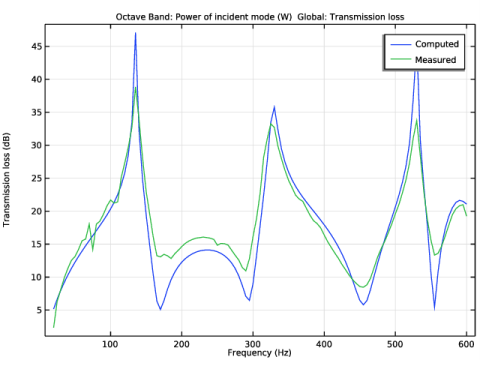
where Pin and Pout denote the total acoustic power at the inlet and the outlet, respectively. The incident and outgoing power flow is automatically calculated by the Port boundary conditions (variables acpr.port1.P_in and acpr.port2.P_out). The Port boundary condition automatically registers the symmetry condition, and calculates the correct total power. For plane wave excitation it is relatively straightforward to calculate the power (it is proportional to p2), however this becomes much more complicated if higher order modes are included. This is taken care of by the built-in expressions available with the Port boundary conditions. Figure 7 displays the Acoustics Module modeling results for the transmission loss as a function of sound frequency together with experimentally measured values.
Figure 7: Transmission loss versus frequency: model simulation results and experimentally measured values.
As the figure shows, the agreement is excellent except in the range 170300 Hz. The relatively limited agreement in the range of 170–300 Hz could be caused by the effects of the flow on the acoustic field, as the measurements were done with air flowing through the muffler. The current model only considers the additional resistance of the perforated plates due to the flow, while in reality the flow will have a more complex effect.
As the acoustic excitation goes higher in frequency, it will start to induce vibrations in the outer shell. The agreement at high frequencies can be improved by including the effect of the shell vibrations as illustrated in the Application Gallery model “Absorptive Muffler with Shells” (www.comsol.com/model/absorptive-muffler-with-shells-14717).
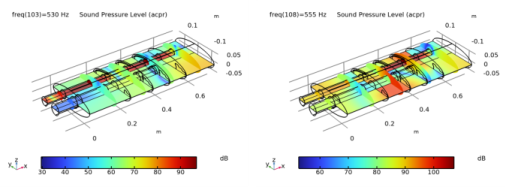
You can get a better sense of the results by studying the sound pressure level field inside the muffler for selected frequencies. The plots in Figure 8 display this field for the frequencies 530 Hz and 555 Hz, respectively. As Figure 7 shows, the former frequency corresponds to a local maximum for the transmission loss whereas the latter gives a local minimum. In Figure 8 you can see these how these properties are related to the sound pressure level distributions near the muffler inlet and outlet.
Figure 8: Sound pressure level distributions at 530 Hz (left) and 555 Hz (right).
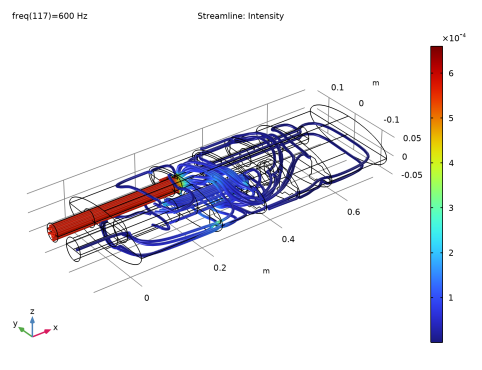
The propagation of the acoustic energy through the muffler system is illustrated in Figure 9 as a streamline plot of the acoustic intensity vector.
Figure 9: Streamline plot of the acoustic intensity field. The color scale represents the magnitude of the acoustic intensity vector.
References
1. E.J. Rice, “A Theoretical Study of the Acoustic Impedance of Orifices in the Presence of a Steady Grazing Flow,” NASA report TM X-71903, 1976.
2. T. Elnady, Modelling and Characterization of Perforates in Lined Ducts and Mufflers, doctoral dissertation, Dept. Aeronautical and Vehicle Eng., Royal Institute of Technology, Stockholm, 2004.
3. R. Kirby, “Transmission Loss Predictions for Dissipative Silencers of Arbitrary Cross Section in the Presence of Mean Flow,” J. Aoust. Soc. Am., vol. 114, pp. 200–209, 2003.
Application Library path: Acoustics_Module/Automotive/perforated_muffler
Modeling Instructions
From the File menu, choose New.
New
In the New window, click  Model Wizard.
Model Wizard
1
In the Model Wizard window, click  3D.
2
In the Select Physics tree, select Acoustics>Pressure Acoustics>Pressure Acoustics, Frequency Domain (acpr).
3
Click Add.
4
Click  Study.
5
In the Select Study tree, select General Studies>Frequency Domain.
6
Geometry 1
A horizontal symmetry plane through the muffler means that it is sufficient to model only half of the geometry. Here, the entire geometry is imported as a sequence from the geometry file. The instructions to the geometry can be found in the appendix at the end of this document.
1
In the Geometry toolbar, click Insert Sequence and choose Insert Sequence.
2
3
In the Geometry toolbar, click  Build All.
You should now see the upper half of a muffler in the drawing area.
Root
Enter the parameters needed for the model or load them from the file perforated_muffler_parameters.txt.
Global Definitions
Parameters 1
1
In the Model Builder window, under Global Definitions click Parameters 1.
2
In the Settings window for Parameters, locate the Parameters section.
3
Definitions
Define the following interpolation function (measurement data) and variable definitions so that you can compute the transmission loss and compare it with experimental data.
Interpolation 1 (int1)
1
In the Home toolbar, click  Functions and choose Local>Interpolation.
2
In the Settings window for Interpolation, locate the Definition section.
3
From the Data source list, choose File.
4
Click  Browse.
5
6
Click  Import.
7
In the Function name text field, type TL_exp.
Materials
The walls of the muffler are considered perfectly rigid and will not use any material properties. The only material you need to select is air.
Add Material
1
In the Home toolbar, click  Add Material to open the Add Material window.
2
Go to the Add Material window.
3
4
Click Add to Component in the window toolbar.
5
In the Home toolbar, click  Add Material to close the Add Material window.
Pressure Acoustics, Frequency Domain (acpr)
With all selections, variables, and material settings completed, it is time to set up the physics.
All boundaries that are exterior to the geometry are by default assigned the Sound Hard boundary condition. Start by applying the Interior Sound Hard condition to the interior rigid walls.
Interior Sound Hard Boundary (Wall) 1
1
In the Model Builder window, under Component 1 (comp1) right-click Pressure Acoustics, Frequency Domain (acpr) and choose Interior Conditions>Interior Sound Hard Boundary (Wall).
2
In the Settings window for Interior Sound Hard Boundary (Wall), locate the Boundary Selection section.
3
From the Selection list, choose Interior Hard Walls.
You need four Interior Perforated Plate conditions, one for each different set of parameters. The Thin plate (default) model type is appropriate here since the value ktp is much less than 1.
Interior Perforated Plate 1
1
In the Physics toolbar, click  Boundaries and choose Interior Perforated Plate.
2
In the Settings window for Interior Perforated Plate, locate the Boundary Selection section.
3
From the Selection list, choose Pipe Perforates.
4
Locate the Interior Perforated Plate section. In the σ text field, type sigma_p.
5
In the tp text field, type t_w.
6
In the dh text field, type d_h.
7
Locate the Fluid Properties section. From the Fluid material list, choose Air (mat1).
Interior Perforated Plate 2
1
In the Physics toolbar, click  Boundaries and choose Interior Perforated Plate.
2
In the Settings window for Interior Perforated Plate, locate the Boundary Selection section.
3
From the Selection list, choose Pipe Perforate with Sleeve.
4
Locate the Interior Perforated Plate section. In the σ text field, type sigma_p.
5
In the tp text field, type t_w.
6
In the dh text field, type d_h.
7
Locate the Fluid Properties section. From the Fluid material list, choose Air (mat1).
8
Locate the Interior Perforated Plate section. Select the User-defined contribution check box.
9
In the θ(user) text field, type 1.
The user-defined resistance represents the impedance contribution from the metallic sleeve outside the pipe.
Interior Perforated Plate 3
1
In the Physics toolbar, click  Boundaries and choose Interior Perforated Plate.
2
In the Settings window for Interior Perforated Plate, locate the Boundary Selection section.
3
From the Selection list, choose Inlet Baffle Perforates.
4
Locate the Interior Perforated Plate section. In the σ text field, type sigma_bi.
5
In the tp text field, type t_w.
6
In the dh text field, type d_h.
7
Locate the Fluid Properties section. From the Fluid material list, choose Air (mat1).
Interior Perforated Plate 4
1
In the Physics toolbar, click  Boundaries and choose Interior Perforated Plate.
2
In the Settings window for Interior Perforated Plate, locate the Boundary Selection section.
3
From the Selection list, choose Outlet Baffle Perforates.
4
Locate the Interior Perforated Plate section. In the σ text field, type sigma_bo.
5
In the tp text field, type t_w.
6
In the dh text field, type d_h.
7
Locate the Fluid Properties section. From the Fluid material list, choose Air (mat1).
Use the Port boundary conditions at the inlet and outlet. Note that the first port at the inlet has an incident field excitation. Both ports capture ingoing and outgoing plane-wave modes. If the frequency range is extended above the cutoff frequency of the first non-plane mode, then add more ports at the inlet and outlet to capture these. The cutoff frequency of a port can be evaluated in postprocessing.
Port 1
1
In the Physics toolbar, click  Boundaries and choose Port.
2
In the Settings window for Port, locate the Boundary Selection section.
3
From the Selection list, choose Inlet.
4
Locate the Port Properties section. From the Type of port list, choose Circular.
5
Locate the Incident Mode Settings section. In the Ain text field, type p0.
Circular Port Reference Axis 1
1
In the Physics toolbar, click  Attributes and choose Circular Port Reference Axis.
Select two points at the inlet boundary to define the reference for the azimuthal angle. This becomes important if higher-order modes are included in the model. Note that because of the symmetry only certain symmetric modes should be selected.
2
In the Settings window for Circular Port Reference Axis, locate the Point Selection section.
3
Click  Clear Selection.
4
Port 2
1
In the Physics toolbar, click  Boundaries and choose Port.
2
In the Settings window for Port, locate the Boundary Selection section.
3
From the Selection list, choose Outlet.
4
Locate the Port Properties section. From the Type of port list, choose Circular.
Circular Port Reference Axis 1
1
In the Physics toolbar, click  Attributes and choose Circular Port Reference Axis.
2
In the Settings window for Circular Port Reference Axis, locate the Point Selection section.
3
Click  Clear Selection.
4
Symmetry 1
1
In the Physics toolbar, click  Boundaries and choose Symmetry.
2
In the Settings window for Symmetry, locate the Boundary Selection section.
3
From the Selection list, choose Symmetry.
Mesh
Proceed and generate the mesh using the Physics-controlled mesh functionality. The frequency controlling the maximum element size is per default taken From study. Set the desired Frequencies in the study step. In general, 5 to 6 second-order elements per wavelength are needed to resolve the waves. For more details, see Meshing (Resolving the Waves) in the Acoustics Module User’s Guide. In this model, we use 8 elements per wavelength; the default Automatic is to have 5.
Study 1
Select to solve for the frequency range from 20 Hz to 600 Hz, in steps of 5 Hz.
Step 1: Frequency Domain
1
In the Model Builder window, under Study 1 click Step 1: Frequency Domain.
2
In the Settings window for Frequency Domain, locate the Study Settings section.
3
In the Frequencies text field, type range(20,5,600).
Mesh 1
1
In the Model Builder window, under Component 1 (comp1) click Mesh 1.
2
In the Settings window for Mesh, locate the Pressure Acoustics, Frequency Domain (acpr) section.
3
From the Number of mesh elements per wavelength list, choose User defined.
4
5
Click  Build All.
Study 1
In the Home toolbar, click  Compute.
Results
Create a Mirror 3D dataset in order to visualize the solution on the full geometry.
Mirror 3D 1
1
In the Results toolbar, click  More Datasets and choose Mirror 3D.
2
In the Settings window for Mirror 3D, locate the Plane Data section.
3
From the Plane list, choose XY-planes.
Acoustic Pressure (acpr)
1
In the Model Builder window, under Results click Acoustic Pressure (acpr).
2
In the Settings window for 3D Plot Group, locate the Data section.
3
From the Dataset list, choose Mirror 3D 1.
4
In the Acoustic Pressure (acpr) toolbar, click  Plot.
The plot shows the pressure distribution on the surface of the muffler. Follow the instructions to see the sound pressure level on a slice inside it.
Surface 1
1
In the Model Builder window, expand the Results>Sound Pressure Level (acpr) node.
2
Right-click Surface 1 and choose Disable.
Sound Pressure Level (acpr)
1
In the Model Builder window, click Sound Pressure Level (acpr).
2
In the Settings window for 3D Plot Group, locate the Data section.
3
From the Dataset list, choose Mirror 3D 1.
Multislice 1
1
In the Sound Pressure Level (acpr) toolbar, click  More Plots and choose Multislice.
2
In the Settings window for Multislice, click Replace Expression in the upper-right corner of the Expression section. From the menu, choose Component 1 (comp1)>Pressure Acoustics, Frequency Domain>Pressure and sound pressure level>acpr.Lp_t - Total sound pressure level - dB.
3
Locate the Multiplane Data section. Find the x-planes subsection. In the Planes text field, type 5.
4
Find the y-planes subsection. In the Planes text field, type 0.
5
In the Sound Pressure Level (acpr) toolbar, click  Plot.
At 600 Hz, most of the sound leaves the inlet pipe through the perforate. Take a look at some other frequencies to reproduce Figure 8.
Sound Pressure Level (acpr)
1
In the Model Builder window, click Sound Pressure Level (acpr).
2
In the Settings window for 3D Plot Group, locate the Data section.
3
From the Parameter value (freq (Hz)) list, choose 530.
4
Click to expand the Title section. From the Title type list, choose Label.
5
Locate the Color Legend section. From the Position list, choose Bottom.
6
In the Sound Pressure Level (acpr) toolbar, click  Plot.
7
Locate the Data section. From the Parameter value (freq (Hz)) list, choose 555.
8
In the Sound Pressure Level (acpr) toolbar, click  Plot.
Acoustic Pressure, Isosurfaces (acpr)
1
In the Model Builder window, click Acoustic Pressure, Isosurfaces (acpr).
2
In the Settings window for 3D Plot Group, locate the Data section.
3
From the Dataset list, choose Mirror 3D 1.
4
In the Acoustic Pressure, Isosurfaces (acpr) toolbar, click  Plot.
The last default plot, depicting pressure isosurfaces should look like the figure below.
To study the transmission loss as a function of the frequency and reproduce Figure 7, add a 1D plot.
Transmission Loss
1
In the Home toolbar, click  Add Plot Group and choose 1D Plot Group.
2
In the Settings window for 1D Plot Group, type Transmission Loss in the Label text field.
3
Locate the Plot Settings section.
4
Select the x-axis label check box. In the associated text field, type Frequency (Hz).
5
Select the y-axis label check box. In the associated text field, type Transmission loss (dB).
6
In the Model Builder window, click Transmission Loss.
Octave Band 1
1
In the Transmission Loss toolbar, click  More Plots and choose Octave Band.
2
In the Settings window for Octave Band, locate the Selection section.
3
From the Geometric entity level list, choose Global.
4
Locate the y-Axis Data section. From the Expression type list, choose Power.
5
In the Expression text field, type acpr.port1.P_in.
6
In the Power reference text field, type acpr.port2.P_out.
7
Locate the Plot section. From the Quantity list, choose Continuous power spectral density.
8
Click to expand the Legends section. Select the Show legends check box.
9
From the Legends list, choose Manual.
10
Transmission Loss
Right-click Octave Band 1 and choose Global.
Global 1
1
In the Settings window for Global, locate the y-Axis Data section.
2
3
Click to expand the Coloring and Style section. Find the Line markers subsection. From the Marker list, choose None.
4
Click to expand the Legends section. From the Legends list, choose Manual.
5
Transmission Loss
1
In the Model Builder window, click Transmission Loss.
2
In the Settings window for 1D Plot Group, locate the Axis section.
3
Clear the x-axis log scale check box.
4
In the Transmission Loss toolbar, click  Plot.
Finally, create a streamline plot of the acoustic intensity vector (SI unit: W/m2) in order to visualize the direction of propagation of the acoustic energy in the muffler system.
Intensity
1
In the Home toolbar, click  Add Plot Group and choose 3D Plot Group.
2
In the Settings window for 3D Plot Group, type Intensity in the Label text field.
3
Locate the Data section. From the Dataset list, choose Mirror 3D 1.
Streamline 1
1
Right-click Intensity and choose Streamline.
2
In the Settings window for Streamline, click Replace Expression in the upper-right corner of the Expression section. From the menu, choose Component 1 (comp1)>Pressure Acoustics, Frequency Domain>Intensity>acpr.Ix,acpr.Iy,acpr.Iz - Intensity.
3
Locate the Coloring and Style section. Find the Line style subsection. From the Type list, choose Tube.
Color Expression 1
1
Right-click Streamline 1 and choose Color Expression.
2
In the Settings window for Color Expression, click Replace Expression in the upper-right corner of the Expression section. From the menu, choose Component 1 (comp1)>Pressure Acoustics, Frequency Domain>Intensity>acpr.I_mag - Intensity magnitude - W/m².
3
In the Intensity toolbar, click  Plot.
The result should look like the plot in Figure 9.
Appendix: Geometry Sequence Instructions
Add Component
In the Home toolbar, click  Add Component and choose 3D.
Geometry 1
Work Plane 1 (wp1)
1
In the Geometry toolbar, click  Work Plane.
2
In the Settings window for Work Plane, locate the Plane Definition section.
3
From the Plane list, choose yz-plane.
Work Plane 1 (wp1)>Plane Geometry
In the Model Builder window, click Plane Geometry.
Work Plane 1 (wp1)>Ellipse 1 (e1)
1
In the Work Plane toolbar, click  Ellipse.
2
In the Settings window for Ellipse, locate the Size and Shape section.
3
In the a-semiaxis text field, type 0.145.
4
In the b-semiaxis text field, type 0.05.
5
In the Sector angle text field, type 180.
Extrude 1 (ext1)
1
In the Model Builder window, under Component 1 (comp1)>Geometry 1 right-click Work Plane 1 (wp1) and choose Extrude.
2
In the Settings window for Extrude, locate the Distances section.
3
Work Plane 2 (wp2)
1
In the Geometry toolbar, click  Work Plane.
2
In the Settings window for Work Plane, locate the Plane Definition section.
3
From the Plane list, choose yz-plane.
4
In the x-coordinate text field, type -0.1.
5
Locate the Unite Objects section. Clear the Unite objects check box.
Work Plane 2 (wp2)>Plane Geometry
In the Model Builder window, click Plane Geometry.
Work Plane 2 (wp2)>Circle 1 (c1)
1
In the Work Plane toolbar, click  Circle.
2
In the Settings window for Circle, locate the Size and Shape section.
3
In the Radius text field, type 28.5[mm].
4
In the Sector angle text field, type 180.
5
Locate the Position section. In the xw text field, type -22.5[mm].
Work Plane 2 (wp2)>Circle 2 (c2)
1
In the Work Plane toolbar, click  Circle.
2
In the Settings window for Circle, locate the Size and Shape section.
3
In the Radius text field, type 22.5[mm].
4
In the Sector angle text field, type 180.
5
Locate the Position section. In the xw text field, type 63[mm].
Extrude 2 (ext2)
1
In the Model Builder window, under Component 1 (comp1)>Geometry 1 right-click Work Plane 2 (wp2) and choose Extrude.
2
In the Settings window for Extrude, locate the General section.
3
4
Click  Remove from Selection.
5
Select the object wp2.c1 only.
6
Locate the Distances section. In the table, enter the following settings:
Extrude 3 (ext3)
1
In the Geometry toolbar, click  Extrude.
2
In the Settings window for Extrude, locate the Distances section.
3
4
Click the  Zoom Extents button in the Graphics toolbar.
Work Plane 3 (wp3)
1
In the Geometry toolbar, click  Work Plane.
2
In the Graphics window toolbar, clicknext to  Select Objects, then choose Select Boundaries.
3
Click the  Click and Hide button in the Graphics toolbar.
4
On the object ext1, select Boundaries 18, 13, 8, 3, 5, 10, 15, and 20 only.
5
Click the  Click and Hide button in the Graphics toolbar.
6
In the Settings window for Work Plane, locate the Plane Definition section.
7
From the Plane type list, choose Face parallel.
8
On the object ext1, select Boundary 6 only.
Work Plane 3 (wp3)>Plane Geometry
In the Model Builder window, click Plane Geometry.
Work Plane 3 (wp3)>Polygon 1 (pol1)
1
In the Work Plane toolbar, click  Polygon.
2
In the Settings window for Polygon, locate the Coordinates section.
3
From the Data source list, choose Vectors.
4
In the xw text field, type -117[mm] -137.5[mm] -137.5[mm] -117[mm] -108[mm] -96.5[mm] -96.5[mm] -117[mm].
5
In the yw text field, type -25[mm] -25[mm] -13.5[mm] -13.5[mm] -4.5[mm] -4.5[mm] -25[mm] -25[mm].
Work Plane 3 (wp3)>Chamfer 1 (cha1)
1
In the Work Plane toolbar, click  Chamfer.
2
On the object pol1, select Points 2 and 7 only.
3
In the Settings window for Chamfer, locate the Distance section.
4
In the Distance from vertex text field, type 2.5[mm].
Work Plane 3 (wp3)>Polygon 2 (pol2)
1
In the Work Plane toolbar, click  Polygon.
2
In the Settings window for Polygon, locate the Coordinates section.
3
From the Data source list, choose Vectors.
4
In the xw text field, type 136.5[mm] 136.5[mm] 136.5[mm] 131[mm] 131[mm] 121[mm] 121[mm] 113.5[mm] 113.5[mm] 105.5[mm] 105.5[mm] 97.3[mm] 97.3[mm] 90[mm] 90[mm] 80.8[mm] 80.8[mm] 72.4[mm] 72.4[mm] 72.4[mm] 72.4[mm] 60[mm] 60[mm] 55[mm] 55[mm] 45.9[mm] 45.9[mm] 37[mm] 37[mm] 28[mm] 28[mm] 28[mm] 28[mm] 37[mm] 37[mm] 45.9[mm] 45.9[mm] 55[mm] 55[mm] 63.8[mm] 63.8[mm] 72.4[mm] 72.4[mm] 80.8[mm] 80.8[mm] 89[mm] 89[mm] 97.3[mm] 97.3[mm] 105.5[mm] 105.5[mm] 113.5[mm] 113.5[mm] 121[mm] 121[mm] 126[mm] 126[mm] 123.3[mm] 123.3[mm] 123.3[mm] 123.3[mm] 136.5[mm] .
5
In the yw text field, type -25[mm] -20.5[mm] -20.5[mm] -12.2[mm] -12.2[mm] -4[mm] -4[mm] -0.1[mm] -0.1[mm] 3.3[mm] 3.3[mm] 6[mm] 6[mm] 8[mm] 8[mm] 10.3[mm] 10.3[mm] 12[mm] 12[mm] 12[mm] 12[mm] 14[mm] 14[mm] 15[mm] 15[mm] 15.7[mm] 15.7[mm] 16.8[mm] 16.8[mm] 17.5[mm] 17.5[mm] 12.5[mm] 12.5[mm] 11.8[mm] 11.8[mm] 10.7[mm] 10.7[mm] 10[mm] 10[mm] 8.5[mm] 8.5[mm] 7[mm] 7[mm] 5.3[mm] 5.3[mm] 3.5[mm] 3.5[mm] 1[mm] 1[mm] -1.7[mm] -1.7[mm] -5.1[mm] -5.1[mm] -9[mm] -9[mm] -12.2[mm] -12.2[mm] -20.5[mm] -20.5[mm] -25[mm] -25[mm] -25[mm] .
Work Plane 4 (wp4)
1
In the Model Builder window, under Component 1 (comp1)>Geometry 1 right-click Work Plane 3 (wp3) and choose Work Plane.
2
In the Settings window for Work Plane, locate the Plane Definition section.
3
From the Plane list, choose yz-plane.
4
From the Plane type list, choose Face parallel.
5
On the object ext1, select Boundary 11 only.
6
Work Plane 4 (wp4)>Plane Geometry
In the Model Builder window, click Plane Geometry.
Work Plane 4 (wp4)>Polygon 1 (pol1)
1
In the Work Plane toolbar, click  Polygon.
2
In the Settings window for Polygon, locate the Coordinates section.
3
From the Data source list, choose Vectors.
4
In the xw text field, type -137.5[mm] -137.5[mm] -135[mm] -117[mm] -108[mm] -96.5[mm] -90[mm] -81[mm] -69.5[mm] -63[mm] -60.5[mm] -63[mm] -63[mm] -69.5[mm] -69.5[mm] -96.5[mm] -117[mm] -137.5[mm].
5
In the yw text field, type -25[mm] -13.5[mm] -13.5[mm] -13.5[mm] -4.5[mm] -4.5[mm] -4.5[mm] 4.5[mm] 4.5[mm] 4.5[mm] 2[mm] -0.5[mm] -3.5[mm] -9[mm] -25[mm] -25[mm] -25[mm] -25[mm].
Work Plane 4 (wp4)>Polygon 2 (pol2)
1
In the Work Plane toolbar, click  Polygon.
2
In the Settings window for Polygon, locate the Coordinates section.
3
From the Data source list, choose Vectors.
4
In the xw text field, type 136.5[mm] 136.5[mm] 136.5[mm] 131[mm] 131[mm] 121[mm] 121[mm] 113.5[mm] 113.5[mm] 105.5[mm] 105.5[mm] 97.3[mm] 97.3[mm] 90[mm] 90[mm] 80.8[mm] 80.8[mm] 72.4[mm] 72.4[mm] 72.4[mm] 72.4[mm] 60[mm] 60[mm] 55[mm] 55[mm] 45.9[mm] 45.9[mm] 37[mm] 37[mm] 28[mm] 28[mm] 28[mm] 28[mm] 37[mm] 37[mm] 45.9[mm] 45.9[mm] 55[mm] 55[mm] 63.8[mm] 63.8[mm] 72.4[mm] 72.4[mm] 80.8[mm] 80.8[mm] 89[mm] 89[mm] 97.3[mm] 97.3[mm] 105.5[mm] 105.5[mm] 113.5[mm] 113.5[mm] 121[mm] 121[mm] 126[mm] 126[mm] 123.3[mm] 123.3[mm] 123.3[mm] 123.3[mm] 136.5[mm] .
5
In the yw text field, type -25[mm] -20.5[mm] -20.5[mm] -12.2[mm] -12.2[mm] -4[mm] -4[mm] -0.1[mm] -0.1[mm] 3.3[mm] 3.3[mm] 6[mm] 6[mm] 8[mm] 8[mm] 10.3[mm] 10.3[mm] 12[mm] 12[mm] 12[mm] 12[mm] 14[mm] 14[mm] 15[mm] 15[mm] 15.7[mm] 15.7[mm] 16.8[mm] 16.8[mm] 17.5[mm] 17.5[mm] 12.5[mm] 12.5[mm] 11.8[mm] 11.8[mm] 10.7[mm] 10.7[mm] 10[mm] 10[mm] 8.5[mm] 8.5[mm] 7[mm] 7[mm] 5.3[mm] 5.3[mm] 3.5[mm] 3.5[mm] 1[mm] 1[mm] -1.7[mm] -1.7[mm] -5.1[mm] -5.1[mm] -9[mm] -9[mm] -12.2[mm] -12.2[mm] -20.5[mm] -20.5[mm] -25[mm] -25[mm] -25[mm] .
Copy 1 (copy1)
1
In the Model Builder window, right-click Geometry 1 and choose Transforms>Copy.
2
3
In the Settings window for Copy, locate the Displacement section.
4
In the x text field, type 0.098.
Copy 2 (copy2)
1
In the Geometry toolbar, click  Transforms and choose Copy.
2
3
In the Settings window for Copy, locate the Displacement section.
4
In the x text field, type 2*0.098.
Delete Entities 1 (del1)
1
Right-click Geometry 1 and choose Delete Entities.
2
On the object copy2, select Boundary 2 only.
3
In the Settings window for Delete Entities, click  Build All Objects.
Union 1 (uni1)
1
In the Geometry toolbar, click  Booleans and Partitions and choose Union.
2
Select the objects ext2 and ext3 only.
3
In the Settings window for Union, locate the Union section.
4
Clear the Keep interior boundaries check box.
Union 2 (uni2)
1
In the Geometry toolbar, click  Booleans and Partitions and choose Union.
2
Select the objects copy1, del1, ext1, wp3, and wp4 only.
Difference 1 (dif1)
1
In the Geometry toolbar, click  Booleans and Partitions and choose Difference.
2
3
In the Settings window for Difference, locate the Difference section.
4
Select the Keep objects to subtract check box.
5
Find the Objects to subtract subsection. Click to select the  Activate Selection toggle button.
6
7
Click  Build Selected.
Form Union (fin)
1
In the Model Builder window, click Form Union (fin).
2
In the Settings window for Form Union/Assembly, click  Build Selected.
Inlet
1
In the Geometry toolbar, click  Selections and choose Explicit Selection.
This section asks you to define a number of boundary selections to use when setting up the physics. To make it easier to select the correct boundaries, you will open the Selection List, where all boundaries are available by numbers. When making your selections, you can Ctrl-click in this list to select several boundaries at once, and use the plus button on the Settings tab to add them to your selection. Note that when working on your own models, it is usually more convenient to make selections by clicking in the geometry.
2
In the Settings window for Explicit Selection, type Inlet in the Label text field.
3
Locate the Entities to Select section. From the Geometric entity level list, choose Boundary.
4
On the object fin, select Boundary 6 only.
Outlet
1
In the Geometry toolbar, click  Selections and choose Explicit Selection.
2
In the Settings window for Explicit Selection, type Outlet in the Label text field.
3
Locate the Entities to Select section. From the Geometric entity level list, choose Boundary.
4
On the object fin, select Boundary 1 only.
Pipe Perforates
1
In the Geometry toolbar, click  Selections and choose Explicit Selection.
2
In the Settings window for Explicit Selection, type Pipe Perforates in the Label text field.
3
Locate the Entities to Select section. From the Geometric entity level list, choose Boundary.
4
On the object fin, select Boundaries 50, 52, 74, and 76 only.
Pipe Perforate with Sleeve
1
In the Geometry toolbar, click  Selections and choose Explicit Selection.
2
In the Settings window for Explicit Selection, type Pipe Perforate with Sleeve in the Label text field.
3
Locate the Entities to Select section. From the Geometric entity level list, choose Boundary.
4
On the object fin, select Boundaries 26 and 28 only.
Inlet Baffle Perforates
1
In the Geometry toolbar, click  Selections and choose Explicit Selection.
2
In the Settings window for Explicit Selection, type Inlet Baffle Perforates in the Label text field.
3
Locate the Entities to Select section. From the Geometric entity level list, choose Boundary.
4
On the object fin, select Boundaries 43, 67, and 91 only.
Outlet Baffle Perforates
1
In the Geometry toolbar, click  Selections and choose Explicit Selection.
2
In the Settings window for Explicit Selection, type Outlet Baffle Perforates in the Label text field.
3
Locate the Entities to Select section. From the Geometric entity level list, choose Boundary.
4
On the object fin, select Boundaries 36, 60, 84, and 101 only.
Pipe Ends
1
In the Geometry toolbar, click  Selections and choose Explicit Selection.
2
In the Settings window for Explicit Selection, type Pipe Ends in the Label text field.
3
Locate the Entities to Select section. From the Geometric entity level list, choose Boundary.
4
On the object fin, select Boundaries 97 and 108 only.
Geometry
1
In the Geometry toolbar, click  Selections and choose Explicit Selection.
2
In the Settings window for Explicit Selection, type Geometry in the Label text field.
3
Locate the Entities to Select section. From the Geometric entity level list, choose Object.
4
Walls
1
In the Geometry toolbar, click  Selections and choose Adjacent Selection.
2
In the Settings window for Adjacent Selection, locate the Input Entities section.
3
4
In the Add dialog box, select Geometry in the Input selections list.
5
6
In the Settings window for Adjacent Selection, locate the Output Entities section.
7
Clear the Exterior boundaries check box.
8
Select the Interior boundaries check box.
9
In the Label text field, type Walls.
Interior Hard Walls
1
In the Geometry toolbar, click  Selections and choose Difference Selection.
2
In the Settings window for Difference Selection, locate the Geometric Entity Level section.
3
From the Level list, choose Boundary.
4
Locate the Input Entities section. Click  Add.
5
In the Add dialog box, select Walls in the Selections to add list.
6
7
In the Settings window for Difference Selection, locate the Input Entities section.
8
9
In the Add dialog box, in the Selections to subtract list, choose Pipe Perforates, Pipe Perforate with Sleeve, Inlet Baffle Perforates, Outlet Baffle Perforates, and Pipe Ends.
10
11
In the Settings window for Difference Selection, type Interior Hard Walls in the Label text field.
Symmetry
1
In the Geometry toolbar, click  Selections and choose Box Selection.
2
In the Settings window for Box Selection, type Symmetry in the Label text field.
3
Locate the Geometric Entity Level section. From the Level list, choose Boundary.
4
Locate the Box Limits section. In the z maximum text field, type 0.01.
5
Locate the Output Entities section. From the Include entity if list, choose Entity inside box.
Form Union (fin)
1
Click the  Wireframe Rendering button in the Graphics toolbar.
The finalized geometry should look like the figure below using Wireframe Rendering.
2
Click the  Wireframe Rendering button in the Graphics toolbar.
Switching back to solid rendering, the geometry should look like the image below.