|
1
|
Click Plot (
 |
|
1
|
Click Plot (
|
|
2
|
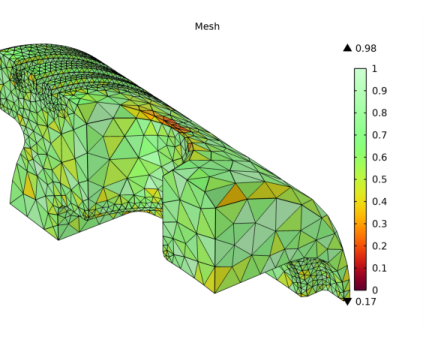
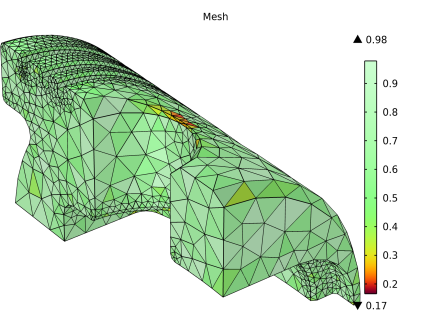
Clear the check box Color range [0,1] to let the colorbar range from the minimum to maximum element quality.
|
|
3
|
Drag the Color calibration parameter slider to change where the middle of the color range is located. Move the slider to a negative value to highlight elements of lower quality more clearly.
 |
|
4
|
You can change the mesh quality measure to display from the Quality measure list. See Mesh Element Quality for more information about the quality measures.
|
|
5
|
In the Settings window for Mesh, select Size instead of Quality from the Element color list to plot the mesh element size instead.
|
|
6
|
Select the Element Filter check box and enter a logical expression in the Expression field to filter out which mesh elements to plot. For example, to only plot elements of quality below 0.001, enter qualskewness<0.001 as the expression. It is also possible to filter based on spatial coordinates (for example, x<0) to see the mesh in a cross section.
|
|
7
|
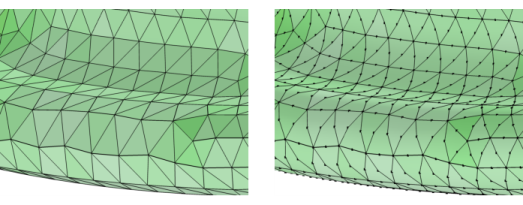
To visualize curved elements (for elements of order two or higher), go to Datasets>Mesh 1 and change the Geometry shape function list to the desired order.
|
|
|
The Geometry shape function setting is a postprocessing setting only and does not influence the discretization used when solving.
|
|
8
|
In the Settings window for Mesh Plot 1>Mesh 1, select Node points: Geometry shape function to also plot higher order node points in the mesh.
 |
|
1
|
|
|
|
|
|