PDF

Bracket — Thermal-Stress Analysis
Introduction
The various examples based on a bracket geometry form a suite of tutorials which summarizes the fundamentals when modeling structural mechanics problems in COMSOL Multiphysics and the Structural Mechanics Module.
In this example you learn how to perform a thermal stress analysis.
Model Definition
The model used in this guide is an assembly of a bracket and its mounting bolts, which are all made of steel. This type of bracket can be used to install an actuator that is mounted on a pin placed between the two holes in the bracket arms. The geometry is shown in Figure 1.
In this example, a temperature distribution is computed in the bracket and the resulting thermal stresses are determined. A heat flux of 10000 W/m2 is applied on the lower side of the bolted plates. On all other boundaries, a convection boundary condition is used. The heat transfer coefficient is 10 W/m2K and room temperature (293.15 K) is used as external temperature.
The four bolts and the
Results
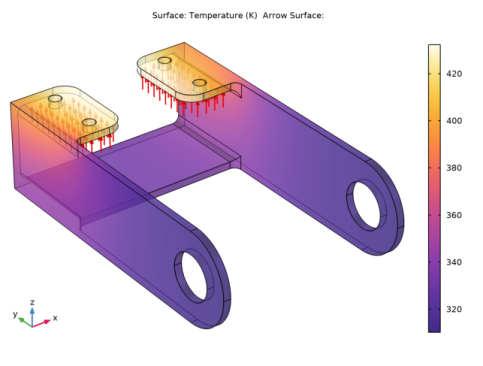
Figure 1shows the temperature distribution in the bracket as well as arrows indicating the prescribed influx of heat. The temperature is highest where the inward heat flux is prescribed, and decreases as heat is removed by convection from all other boundaries.
Figure 1: Temperature distribution in the bracket. The prescribed heat flux is indicated by arrows.
Figure 2 shows the von Mises stress distribution in the bracket. You can see how the bracket is deformed by the thermal expansion. Due to the boundary conditions and the non-uniform temperature distribution, thermal stresses develop in the structure.
Figure 2: Von Mises stress distribution in the bracket.
Notes About the COMSOL Implementation
COMSOL Multiphysics contains physics interfaces for structural analysis as well as thermal analysis. You can set up the coupled analysis for thermal-structure interaction using three different methods:
Add a Thermal Stress, Solid interface as in this example. The coupling is predefined and appears in the Thermal Expansion nodes under Multiphysics. This is the easiest approach.
Add separate Solid Mechanics and Heat Transfer in Solids interfaces. Then add a Thermal Expansion node under Multiphysics, and check the settings in them.
Add separate Solid Mechanics and Heat Transfer in Solids interfaces. Add a Thermal Expansion subnode under Linear Elastic Material, and do the appropriate settings there.
Application Library path: Structural_Mechanics_Module/Tutorials/bracket_thermal
Modeling Instructions
From the File menu, choose New.
New
In the New window, click  Model Wizard.
Model Wizard
1
In the Model Wizard window, click  3D.
2
In the Select Physics tree, select Structural Mechanics>Thermal-Structure Interaction>Thermal Stress, Solid.
3
Click Add.
4
Click  Study.
5
In the Select Study tree, select General Studies>Stationary.
6
Geometry 1
The Thermal Stress, Solid interface is a multiphysics interface that combines a Solid Mechanics interface with a Heat Transfer in Solids interface. You can see the coupling between the physics interfaces under the Multiphysics node.
Import 1 (imp1)
1
In the Home toolbar, click  Import.
2
In the Settings window for Import, locate the Import section.
3
From the Source list, choose COMSOL Multiphysics file.
4
Click  Browse.
5
6
Click  Import.
7
Click the  Zoom Extents button in the Graphics toolbar.
Form Union (fin)
1
In the Model Builder window, click Form Union (fin).
2
In the Settings window for Form Union/Assembly, click  Build Selected.
Add Material
1
In the Home toolbar, click  Add Material to open the Add Material window.
2
Go to the Add Material window.
3
In the tree, select Built-in>Structural steel.
4
Click Add to Component in the window toolbar.
5
In the Home toolbar, click  Add Material to close the Add Material window.
Solid Mechanics (solid)
Now specify the boundary conditions for the Solid Mechanics interface.
Roller 1
1
In the Model Builder window, under Component 1 (comp1) right-click Solid Mechanics (solid) and choose Roller.
2
Spring Foundation 1
1
In the Physics toolbar, click  Boundaries and choose Spring Foundation.
2
3
In the Settings window for Spring Foundation, locate the Spring section.
4
From the Spring type list, choose Total spring constant.
5
6
In the ktot table, enter the following settings:
Heat Transfer in Solids (ht)
In the Model Builder window, under Component 1 (comp1) click Heat Transfer in Solids (ht).
Heat Flux 1
1
In the Physics toolbar, click  Boundaries and choose Heat Flux.
2
From the Selection list, choose All boundaries. Then remove boundaries 17 and 27.
3
In the Settings window for Heat Flux, locate the Heat Flux section.
4
From the Flux type list, choose Convective heat flux.
5
In the h text field, type 10.
Heat Flux 2
1
In the Physics toolbar, click  Boundaries and choose Heat Flux.
2
3
In the Settings window for Heat Flux, locate the Heat Flux section.
4
In the q0 text field, type 1e4.
Study 1
In the Home toolbar, click  Compute.
Results
Stress (solid)
Under the Results node, three plot groups are automatically added to show the default results for the structural and thermal analyses. The first plot group, Stress (solid), shows the von Mises stresses on a scaled deformed geometry, as shown in Figure 2.
Volume 1
1
In the Model Builder window, expand the Stress (solid) node, then click Volume 1.
2
In the Settings window for Volume, locate the Expression section.
3
From the Unit list, choose MPa.
4
In the Stress (solid) toolbar, click  Plot.
5
Click the  Show Grid button in the Graphics toolbar.
6
Click the  Zoom Extents button in the Graphics toolbar.
7
In the Stress (solid) toolbar, click  Plot.
Temperature (ht)
The second plot group, Temperature (ht), displays the temperature distribution. Add some arrows indicating the thermal loading.
Arrow Surface 1
1
In the Model Builder window, right-click Temperature (ht) and choose Arrow Surface.
2
In the Settings window for Arrow Surface, locate the Expression section.
3
In the X component text field, type 0.
4
In the Y component text field, type 0.
5
In the Z component text field, type 1.
6
Locate the Coloring and Style section. From the Arrow base list, choose Head.
Selection 1
1
Right-click Arrow Surface 1 and choose Selection.
2
Arrow Surface 1
1
In the Model Builder window, click Arrow Surface 1.
2
In the Settings window for Arrow Surface, locate the Arrow Positioning section.
3
In the Number of arrows text field, type 100.
4
Locate the Coloring and Style section. Select the Scale factor check box.
5
Transparency 1
1
In the Model Builder window, right-click Surface and choose Transparency.
2
In the Settings window for Transparency, locate the Transparency section.
3
Set the Transparency value to 0.4.
4
Set the Fresnel transmittance value to 0.4.
5
In the Temperature (ht) toolbar, click  Plot.