PDF

Double-Ridged Horn Antenna
Introduction
A double-ridged horn antenna is popularly used in an anechoic chamber to characterize an antenna under test (AUT) from S-band to Ku-band due to its reliable performance in a wideband frequency range. The model computes the voltage standing wave ratio (VSWR), far-field radiation pattern, and antenna directivity.
Figure 1: Double-ridged horn antenna excited by a coaxial port. The surrounding air domain and a perfectly matched layer, which is required for the simulation, are not included in this figure.
Note: This example requires the RF Module and the Design Module.
Model Definition
The simulation frequency range is from 2 GHz to 6 GHz. The conductivity of the metallic material in the model is assumed to be high enough to neglect the loss in the given frequency range. Thus, all metal parts are modeled using a perfect electric conductor (PEC) feature. An exponential function, e0.028x is used in a parametric curve to create the tapered metallic ridges that are excited by an SMA type dielectric-filled coaxial connector. A lumped port is assigned on the boundary between the inner and outer conducting surface at the end of the coaxial connector. The antenna is enclosed by a spherical air domain. The outermost layer of the air domain is configured as a perfectly matched layer (PML) where the thickness of the layer is slightly greater than 0.1 wavelengths at the lowest simulation frequency. The PML absorbs all outgoing radiation from the antenna and work as an anechoic chamber during the simulation. The mesh is controlled by the Electromagnetic Waves, Frequency Domain physics interface and it has to be defined dynamically based on each simulation frequency, so frequency parametric sweep is over Frequency Domain study step.
Results and Discussion
In Figure 2, the slice and contour plot of Ez is visualized in the zx-plane. The electric field is guided by two symmetric metallic ridges and propagating toward the aperture of the horn.
Figure 2: z-component of the electric field and its contour plot at 6 GHz.
Figure 3 shows the 3D far-field radiation pattern. When it is plotted, the directivity is also calculated which is around 12.9 dB. Other antenna far-field postprocessing variables such as antenna gain and axial ratio can be visualized using the same plot by replacing the default input fields both for expression and color. These steps are not included in this tutorial but you are encouraged to try.
Figure 3: 3D far-field radiation pattern that is directive toward the open aperture.
Voltage standing wave ratio (VSWR) is a measure commonly used to characterize the input impedance matching properties for off-the-shelf antenna products. Figure 4 presents the VSWR of the double-ridged horn antenna that is lower than 1.7 in the simulated frequency range.
Figure 4: Voltage standing wave ratio (VSWR) plot. It is better than 2:1 in the simulated frequency range
Notes About the COMSOL Implementation
The antenna model is memory intensive and requires more than 12 GB RAM for the simulation up to 6 GHz. It may require much more for higher frequency simulations.
Application Library path: RF_Module/Antennas/double_ridged_horn_antenna
Modeling Instructions
From the File menu, choose New.
New
In the New window, click  Model Wizard.
Model Wizard
1
In the Model Wizard window, click  3D.
2
In the Select Physics tree, select Radio Frequency>Electromagnetic Waves, Frequency Domain (emw).
3
Click Add.
4
Click  Study.
5
In the Select Study tree, select General Studies>Frequency Domain.
6
Global Definitions
Parameters 1
1
In the Model Builder window, under Global Definitions click Parameters 1.
2
In the Settings window for Parameters, locate the Parameters section.
3
Study 1
Step 1: Frequency Domain
1
In the Model Builder window, under Study 1 click Step 1: Frequency Domain.
2
In the Settings window for Frequency Domain, locate the Study Settings section.
3
In the Frequencies text field, type f0.
Geometry 1
1
In the Model Builder window, under Component 1 (comp1) click Geometry 1.
2
In the Settings window for Geometry, locate the Units section.
3
From the Length unit list, choose mm.
4
Locate the Advanced section. From the Geometry representation list, choose CAD kernel.
Work Plane 1 (wp1)
1
In the Geometry toolbar, click  Work Plane.
2
In the Settings window for Work Plane, locate the Plane Definition section.
3
From the Plane list, choose xz-plane.
4
In the y-coordinate text field, type 3.5.
Work Plane 1 (wp1)>Plane Geometry
In the Model Builder window, click Plane Geometry.
Work Plane 1 (wp1)>Parametric Curve 1 (pc1)
1
In the Work Plane toolbar, click  More Primitives and choose Parametric Curve.
2
In the Settings window for Parametric Curve, locate the Parameter section.
3
In the Maximum text field, type 150.
4
Locate the Expressions section. In the xw text field, type s-100.
5
In the yw text field, type exp(0.028*s)-1+w_slot/2.
Work Plane 1 (wp1)>Mirror 1 (mir1)
1
In the Work Plane toolbar, click  Transforms and choose Mirror.
2
3
In the Settings window for Mirror, locate the Input section.
4
Select the Keep input objects check box.
5
Locate the Normal Vector to Line of Reflection section. In the xw text field, type 0.
6
In the yw text field, type 1.
Work Plane 1 (wp1)>Rectangle 1 (r1)
1
In the Work Plane toolbar, click  Rectangle.
2
In the Settings window for Rectangle, locate the Size and Shape section.
3
In the Width text field, type 20.15.
4
In the Height text field, type w_slot.
5
Locate the Position section. In the xw text field, type -120.15.
6
In the yw text field, type -w_slot/2.
7
Click  Build Selected.
8
Click the  Zoom Extents button in the Graphics toolbar.
Work Plane 1 (wp1)>Rectangle 2 (r2)
1
In the Work Plane toolbar, click  Rectangle.
2
In the Settings window for Rectangle, locate the Size and Shape section.
3
In the Width text field, type 20.15.
4
In the Height text field, type 30.
5
Locate the Position section. In the xw text field, type -120.15.
6
In the yw text field, type -15.
Work Plane 1 (wp1)>Polygon 1 (pol1)
1
In the Work Plane toolbar, click  Polygon.
2
In the Settings window for Polygon, locate the Coordinates section.
3
From the Data source list, choose Vectors.
4
In the xw text field, type 50 -100 -100 -100 -100 50.
5
In the yw text field, type exp(0.028*150)-1+w_slot/2 15 15 -15 -15 -(exp(0.028*150)-1+w_slot/2).
Extrude 1 (ext1)
1
In the Model Builder window, right-click Geometry 1 and choose Extrude.
2
In the Settings window for Extrude, locate the Distances section.
3
Work Plane 2 (wp2)
1
In the Geometry toolbar, click  Work Plane.
2
In the Settings window for Work Plane, locate the Plane Definition section.
3
From the Plane list, choose yz-plane.
4
In the x-coordinate text field, type 50.
Work Plane 2 (wp2)>Plane Geometry
In the Model Builder window, click Plane Geometry.
Work Plane 2 (wp2)>Rectangle 1 (r1)
1
In the Work Plane toolbar, click  Rectangle.
2
In the Settings window for Rectangle, locate the Size and Shape section.
3
In the Width text field, type 190.
4
In the Height text field, type (exp(0.028*150)-1+w_slot/2)*2.
5
Locate the Position section. In the xw text field, type -95.
6
In the yw text field, type -(exp(0.028*150)-1+w_slot/2).
Work Plane 3 (wp3)
1
In the Model Builder window, right-click Geometry 1 and choose Work Plane.
2
In the Settings window for Work Plane, locate the Plane Definition section.
3
From the Plane list, choose yz-plane.
4
In the x-coordinate text field, type -100.
Work Plane 3 (wp3)>Plane Geometry
In the Model Builder window, click Plane Geometry.
Work Plane 3 (wp3)>Rectangle 1 (r1)
1
In the Work Plane toolbar, click  Rectangle.
2
In the Settings window for Rectangle, locate the Size and Shape section.
3
In the Width text field, type 50.
4
In the Height text field, type 30.
5
Locate the Position section. In the xw text field, type -25.
6
In the yw text field, type -15.
Extrude 2 (ext2)
1
In the Model Builder window, right-click Geometry 1 and choose Extrude.
2
In the Settings window for Extrude, locate the General section.
3
From the Input object handling list, choose Keep.
4
Locate the Distances section. In the table, enter the following settings:
5
Select the Reverse direction check box.
Loft 1 (loft1)
1
In the Geometry toolbar, click  Loft.
2
Click the  Wireframe Rendering button in the Graphics toolbar.
3
Click the  Zoom Extents button in the Graphics toolbar.
4
Select the objects wp2 and wp3 only.
Cylinder 1 (cyl1)
1
In the Geometry toolbar, click  Cylinder.
2
In the Settings window for Cylinder, locate the Size and Shape section.
3
In the Radius text field, type 2.05.
4
In the Height text field, type 15-w_slot/2.
5
Locate the Position section. In the x text field, type -117.5.
6
In the z text field, type w_slot/2.
Cylinder 2 (cyl2)
1
Right-click Cylinder 1 (cyl1) and choose Duplicate.
2
In the Settings window for Cylinder, locate the Size and Shape section.
3
In the Radius text field, type 0.635.
4
In the Height text field, type 15+w_slot/2.
5
Locate the Position section. In the z text field, type -w_slot/2.
Part Libraries
1
In the Geometry toolbar, click  Parts and choose Part Libraries.
2
In the Model Builder window, click Geometry 1.
3
In the Part Libraries window, select RF Module>Connectors>connector_sma_flange2 in the tree.
4
Click  Add to Geometry.
Geometry 1
SMA Connector, Flange with Two Holes 1 (pi1)
1
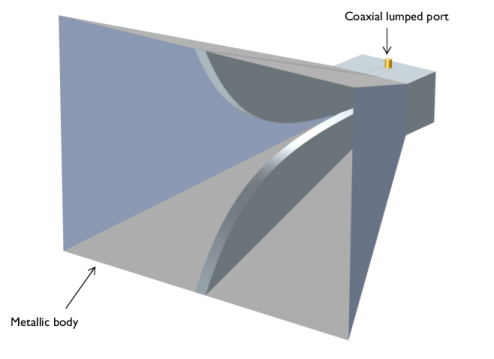
In the Model Builder window, under Component 1 (comp1)>Geometry 1 click SMA Connector, Flange with Two Holes 1 (pi1).
2
In the Settings window for Part Instance, locate the Input Parameters section.
3
4
Locate the Position and Orientation of Output section. Find the Displacement subsection. In the xw text field, type -117.5.
5
In the zw text field, type 15.
6
Find the Rotation subsection. From the Axis type list, choose yw-axis.
7
In the Rotation angle text field, type 90.
8
Click to expand the Boundary Selections section. In the table, enter the following settings:
9
Click to expand the Domain Selections section. In the table, enter the following settings:
10
Click  Build Selected.
Sphere 1 (sph1)
1
In the Geometry toolbar, click  Sphere.
2
In the Settings window for Sphere, locate the Size section.
3
In the Radius text field, type 170.
4
Click to expand the Layers section. In the table, enter the following settings:
5
In the Geometry toolbar, click  Build All.
Definitions
Perfectly Matched Layer 1 (pml1)
1
In the Definitions toolbar, click  Perfectly Matched Layer.
2
3
In the Settings window for Perfectly Matched Layer, locate the Geometry section.
4
From the Type list, choose Spherical.
Add Material
1
In the Home toolbar, click  Add Material to open the Add Material window.
2
Go to the Add Material window.
3
4
Right-click and choose Add to Component 1 (comp1).
5
In the Home toolbar, click  Add Material to close the Add Material window.
Materials
Material 2 (mat2)
1
In the Model Builder window, under Component 1 (comp1) right-click Materials and choose Blank Material.
2
3
In the Settings window for Material, locate the Material Contents section.
4
Material 3 (mat3)
1
Right-click Material 2 (mat2) and choose Duplicate.
2
In the Settings window for Material, locate the Geometric Entity Selection section.
3
From the Selection list, choose Dielectric (SMA Connector, Flange with Two Holes 1).
Electromagnetic Waves, Frequency Domain (emw)
Perfect Electric Conductor 2
1
In the Model Builder window, under Component 1 (comp1) right-click Electromagnetic Waves, Frequency Domain (emw) and choose Perfect Electric Conductor.
2
In the Settings window for Perfect Electric Conductor, locate the Boundary Selection section.
3
Click  Paste Selection.
4
In the Paste Selection dialog box, type 13-17, 28-30, 33-36, 45, 47, 50, 51, 53, 54, 66, 69-73, 75-79, 81, 82, 94, 95, 98-101, 103-106, 108, 109, 122, 124-126, 128, 129, 132, 134-136, 138, 139, 141-143 in the Selection text field.
5
Perfect Electric Conductor 3
1
In the Physics toolbar, click  Boundaries and choose Perfect Electric Conductor.
2
In the Settings window for Perfect Electric Conductor, locate the Boundary Selection section.
3
From the Selection list, choose Conductive surface (SMA Connector, Flange with Two Holes 1).
Lumped Port 1
1
In the Physics toolbar, click  Boundaries and choose Lumped Port.
2
3
In the Settings window for Lumped Port, locate the Lumped Port Properties section.
4
From the Type of lumped port list, choose Coaxial.
For the first port, wave excitation is on by default.
Far-Field Domain 1
In the Physics toolbar, click  Domains and choose Far-Field Domain.
Definitions
Hide for Physics 1
1
In the Model Builder window, right-click View 1 and choose Hide for Physics.
2
In the Settings window for Hide for Physics, locate the Geometric Entity Selection section.
3
From the Geometric entity level list, choose Boundary.
4
Mesh 1
1
In the Model Builder window, under Component 1 (comp1) click Mesh 1.
2
In the Settings window for Mesh, locate the Physics-Controlled Mesh section.
3
From the Element size list, choose Coarser.
Use Coarser mesh to avoid unnecessarily fine mesh on small parts.
4
Click  Build All.
Study 1
Parametric Sweep
1
In the Study toolbar, click  Parametric Sweep.
2
In the Settings window for Parametric Sweep, locate the Study Settings section.
3
4
Step 1: Frequency Domain
In the Study toolbar, click  Compute.
Results
Multislice
1
In the Model Builder window, expand the Electric Field (emw) node, then click Multislice.
2
In the Settings window for Multislice, locate the Expression section.
3
In the Expression text field, type emw.Ez.
4
Locate the Multiplane Data section. Find the X-planes subsection. In the Planes text field, type 0.
5
Find the Z-planes subsection. In the Planes text field, type 0.
6
Click to expand the Range section. Select the Manual color range check box.
7
In the Minimum text field, type -100.
8
In the Maximum text field, type 100.
Selection 1
1
Right-click Multislice and choose Selection.
2
3
In the Electric Field (emw) toolbar, click  Plot.
Cut Plane 1
1
In the Results toolbar, click  Cut Plane.
2
In the Settings window for Cut Plane, locate the Data section.
3
From the Dataset list, choose Study 1/Parametric Solutions 1 (sol2).
4
Locate the Plane Data section. From the Plane list, choose XZ-planes.
Contour 1
1
In the Model Builder window, right-click Electric Field (emw) and choose Contour.
2
In the Settings window for Contour, locate the Data section.
3
From the Dataset list, choose Cut Plane 1.
4
Locate the Expression section. In the Expression text field, type emw.Ez.
5
Locate the Levels section. In the Total levels text field, type 30.
6
Locate the Coloring and Style section. From the Color table list, choose Cividis.
Surface 1
1
Right-click Electric Field (emw) and choose Surface.
2
In the Settings window for Surface, locate the Coloring and Style section.
3
Clear the Color legend check box.
4
From the Color table list, choose AuroraAustralis.
Selection 1
1
Right-click Surface 1 and choose Selection.
2
In the Settings window for Selection, locate the Selection section.
3
From the Selection list, choose Conductive surface (SMA Connector, Flange with Two Holes 1).
Surface 2
1
In the Model Builder window, right-click Electric Field (emw) and choose Surface.
2
In the Settings window for Surface, locate the Coloring and Style section.
3
From the Color table list, choose AuroraAustralis.
4
Clear the Color legend check box.
Selection 1
1
Right-click Surface 2 and choose Selection.
2
3
In the Electric Field (emw) toolbar, click  Plot.
Compare the reproduced plot with that shown in Figure 2.
Radiation Pattern 1
1
In the Model Builder window, expand the 2D Far Field (emw) node, then click Radiation Pattern 1.
2
In the Settings window for Radiation Pattern, click to expand the Legends section.
3
From the Legends list, choose Manual.
4
5
In the 2D Far Field (emw) toolbar, click  Plot.
Radiation Pattern 1
1
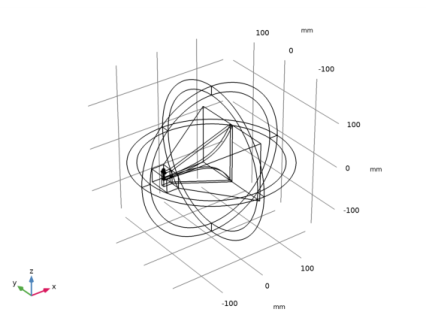
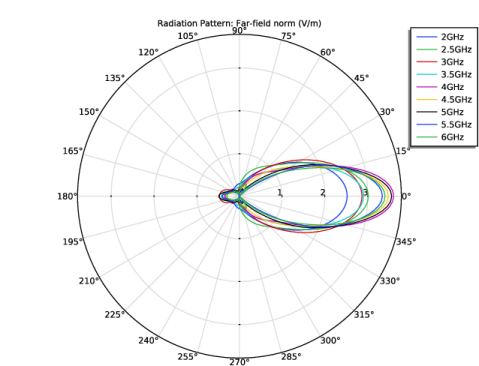
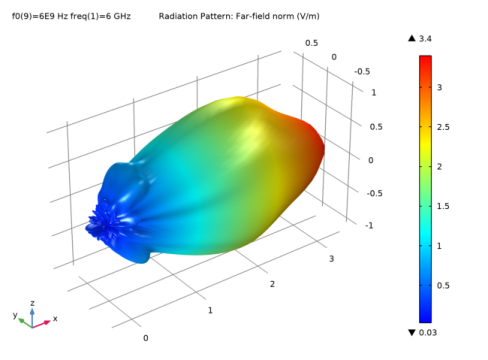
In the Model Builder window, expand the Results>3D Far Field, Gain (emw) node, then click Radiation Pattern 1.
2
In the Settings window for Radiation Pattern, locate the Evaluation section.
3
Find the Angles subsection. In the Number of elevation angles text field, type 90.
4
In the Number of azimuth angles text field, type 90.
5
In the 3D Far Field, Gain (emw) toolbar, click  Plot.
Table
1
Go to the Table window.
3D far-field radiation pattern is directive toward the aperture of the horn antenna (Figure 3).
Results
1D Plot Group 6
1
In the Home toolbar, click  Add Plot Group and choose 1D Plot Group.
2
In the Settings window for 1D Plot Group, locate the Data section.
3
From the Dataset list, choose Study 1/Parametric Solutions 1 (sol2).
Global 1
1
Right-click 1D Plot Group 6 and choose Global.
2
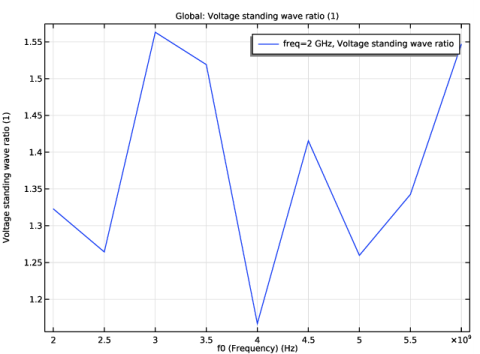
In the Settings window for Global, click Add Expression in the upper-right corner of the y-Axis Data section. From the menu, choose Component 1 (comp1)>Electromagnetic Waves, Frequency Domain>Ports>emw.VSWR_1 - Voltage standing wave ratio.
3
Locate the x-Axis Data section. From the Axis source data list, choose Outer solutions.
4
In the 1D Plot Group 6 toolbar, click  Plot.
Compare the resulting VSWR plot to Figure 4.