PDF

Lithium-Ion Battery Internal Resistance
Introduction
This application investigates the rate capability of a battery further and shows how the Lithium-Ion Battery interface is an excellent modeling tool for this.
The rate capability is studied in terms of polarization (voltage loss) or the internal resistance causing this loss. A typical high current pulse test, a Hybrid Pulse Power Characterization (HPPC) test, is simulated here for this purpose. Primarily, the first 10 s discharge and the subsequent relaxation at are looked upon.
The Lithium-Ion Battery interface takes into account many physical battery properties of which some can be pinned down as design parameters directly affecting rate capability. These are (Ref. 1 and Ref. 2):
Properties that decrease the internal resistance are normally thin battery domains, high porosities, and small active material particles. A battery with the opposite design features has high internal resistance, but can due to large active material particles and thick packed electrodes be able to store a lot capacity (energy). This explains why a battery cannot have both high energy and power output; that is, the battery is either power-optimized or energy-optimized.
Figure 1: Selection of design parameters in cell with separator and their relation to increased internal resistance. Upward pointing arrows indicate increase, downward pointing decrease. For example, the internal resistance increases with decreased porosity and increased particle size.
The choice of active materials are important as well. Some materials are able to shift their lithium concentration efficiently even at high current loads. Additionally, the electrolyte is also important; for example, polymer batteries are seldom power-optimized since these contain a nonliquid electrolyte with poor lithium-ion transport properties.
Three parameters are varied in the application: The state-of-charge (SOC) of the cell (which in turn dictates the SOC of each electrode), the porosity of the positive electrode, and the particle size of the positive active electrode material. Thus, together with the original design, four cases are compared.
More battery parameters and additional variable definitions used here are found in the Lithium-Ion Battery Seed application.
Model Definition
The model is set up for a graphite/LMO battery cell. The materials are available from the Battery Material Library and mainly default settings are selected. The model domains consist of:
Negative porous electrode: Graphite (MCMB LixC6) active material and electronic conductor.
Positive porous electrode: LMO (LiMn2O4) active material, electronic conductor, and filler.
Electrolyte: 1.0 M LiPF6 in EC:DEC (1:1 by weight).
This battery cell assembly gives a cell voltage around 4 V, depending on the state-of-charge (SOC) of the cell.
The Lithium-Ion Battery interface accounts for:
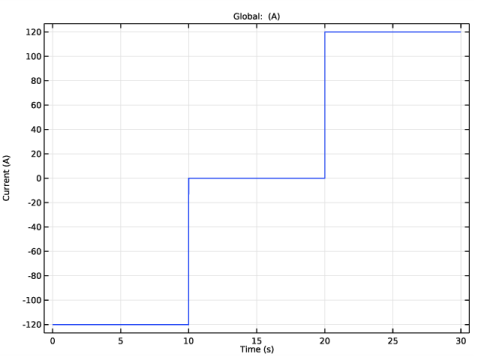
The current pulse is charge neutral and contains 10 s of 10C discharge, 10 s relaxation, and 10 s of 10C charge. In Figure 2 the pulse is displayed.
Figure 2: Charge neutral high current pulse used in model.
Additionally, the model calculates the energy efficiency of the pulse as the ratio between the energy output, Wout, and input, Win.
(1)
The nominator and denominator in Equation 1 are solved with Global ODEs and DAEs.
The initial cell SOC is set to 0.6, using the Initial Cell Charge Distribution feature.
Results and Discussion
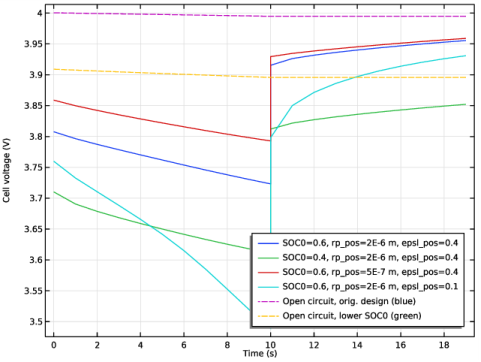
The cell voltage during the first 10 s 10C discharge and 10 s relaxation is shown in Figure 3. Compared to the open-circuit cell voltage, polarization is present in all four cases.
In Figure 3, it is shown that the lowered initial cell SOC (40%) lowers the voltage all through the pulse. The material properties affected by the cell SOC are the open-circuit potentials (OCP) of the electrodes and the electrochemical reaction rate in this model. However, the changes seem to be mainly due to the OCPs, since the magnitude of the OCPs differ significantly between 40% and 60% cell SOC.
Figure 3: Cell voltage behavior for the different designs during the first 20 s of the pulse. (SOC0 equals initial cell SOC.)
The cell voltage increases considerably when the positive active material particle size is decreased, showing that a major part of the internal resistance originates from there in the original design. In contrast, the lowered porosity in the positive electrode shows that the electrolyte part of the positive electrode requires a quite high porosity (0.4) to efficiently transport lithium ions.
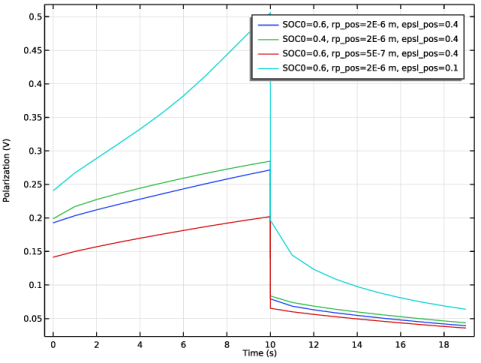
In Figure 4, the total polarization, which is equal to the difference between the cell voltage and open-circuit voltage, is shown. The polarization seems to depend on both instantaneous and time-dependent internal resistances. The former gives an immediate voltage drop when the current is turned on or off, the latter increases the drop more slowly, and is the only resistance that is observed during the relaxation period. The instantaneous behavior has to do mainly with ohmic resistances, such as conductivity, and the time-dependent one with slow mass transport processes, for example, diffusion, in the electrolyte and the active materials. The calculated internal resistance is calculated from Ohm’s law at the end of the 10C discharge, as shown in Equation 2.
(2)
The resistances calculated for the different cases are (in the order presented in the plot legends, top down): 2.0 m⋅Ω. 2.1 m⋅Ω., 1.4 m⋅Ω., and 4.1 m⋅Ω.
Figure 4: Total polarization (EOCV,cell-Ecell) in the different designs during the first 20 s of the pulse.
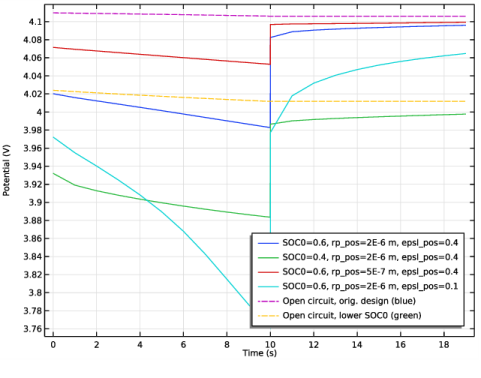
In Figure 5 and Figure 6, the potentials and OCPs are shown for the two electrodes. The internal resistance in both electrodes is almost the same. The polarization, given by the difference in potential and open-circuit potential, is approximately 10 mV in both electrodes..
Figure 5: Positive electrode potential during the first 20 s of the pulse.
Figure 6: Negative electrode potential during the first 20 s of the pulse.
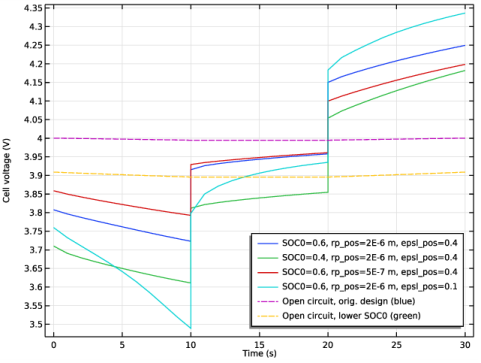
The energy efficiency of the battery during the pulse should be considerably less than 100% due to the polarization. Both the discharge and charge give considerable polarization, as shown in Figure 7. The energy efficiency is calculated from Equation 1 and becomes (in the order presented in the plot legends, top down): 90.8 %, 89.9 %, 93.4 % and 87.8 %.
Figure 7: Cell voltage behavior for the different battery designs during the whole pulse.
Reference
1. M. Doyle, J. Newman, A.S. Gozdz, C.N. Schmutz, and J.M. Tarascon, “Comparison of Modeling Predictions with Experimental Data from Plastic Lithium Ion Cells,” J. Electrochem. Soc., vol. 143, no. 6, pp. 1890–1903, 1996.
2. A. Nyman, T. G. Zavalis, R. Elger, M. Behm, and G. Lindbergh, “Analysis of the Polarization in Li-Ion Battery Cell by Numerical Simulations,” J. Electrochem. Soc., vol. 157, no. 11, pp. A1236–A1246, 2010.
Application Library path: Battery_Design_Module/Batteries,_Lithium-Ion/li_battery_internal_resistance
Modeling Instructions
Application Libraries
1
From the File menu, choose Application Libraries.
2
In the Application Libraries window, select Battery Design Module>Batteries, Lithium-Ion>li_battery_seed in the tree.
3
Global Definitions
The rate capability of three battery parameters are tested: the initial cell state-of-charge (SOC), the porosity, and particle size of the positive electrode. These are added to the global parameters to enable parameter variation. Replace the initial cell voltage to initial cell state-of-charge, since the former is no longer needed.
Parameters 1
1
In the Model Builder window, under Global Definitions click Parameters 1.
2
In the Settings window for Parameters, locate the Parameters section.
3
Definitions (comp1)
Load the variables from a text file.
Variables 1
1
In the Model Builder window, expand the Component 1 (comp1)>Definitions node.
2
Right-click Component 1 (comp1)>Definitions and choose Variables.
3
In the Settings window for Variables, locate the Variables section.
4
Click  Load from File.
5
Piecewise 1 (pw1)
Set up the pulse with a Piecewise function. The pulse is 10 s of discharge, followed by 10 s of relaxation, and 10 s of charge.
1
In the Home toolbar, click  Functions and choose Local>Piecewise.
2
In the Settings window for Piecewise, type pulse in the Function name text field.
3
Locate the Definition section. From the Smoothing list, choose Continuous function.
4
From the Transition zone list, choose Absolute size.
5
In the Size of transition zone text field, type smooth.
6
Find the Intervals subsection. In the table, enter the following settings:
7
Locate the Units section. In the Arguments text field, type s.
8
Variables 1
Set up the current pulse in the variable list.
1
In the Model Builder window, click Variables 1.
2
In the Settings window for Variables, locate the Variables section.
3
Lithium-Ion Battery (liion)
Electrode Current -Current Load Rates
1
In the Model Builder window, under Component 1 (comp1)>Lithium-Ion Battery (liion) click Electrode Current 1.
2
In the Settings window for Electrode Current, type Electrode Current -Current Load Rates in the Label text field.
3
Locate the Electrode Current section. In the Is,total text field, type I_pulse.
Porous Electrode 1
In the Particle Intercalation nodes of the Porous Electrode features, it is useful to enable fast assembly in the particle dimension option. This option enables an alternative method for assembling of the diffusion equation in the particle dimension, that typically decreases computation time for 1D models. Note that the same diffusion equations are solved for regardless of assembly method. Additionally, specify the reference exchange current density for the electrode kinetics in the Porous Electrode Reaction nodes. Also, introduce the parameters that are to be varied, into the Lithium-Ion Battery interface.
Particle Intercalation 1
1
In the Model Builder window, expand the Porous Electrode 1 node, then click Particle Intercalation 1.
2
In the Settings window for Particle Intercalation, click to expand the Particle Discretization section.
3
Select the Fast assembly in particle dimension check box.
Porous Electrode Reaction 1
1
In the Model Builder window, click Porous Electrode Reaction 1.
2
In the Settings window for Porous Electrode Reaction, locate the Electrode Kinetics section.
3
In the i0,ref(T) text field, type i0ref_neg.
Porous Electrode 2
1
In the Model Builder window, under Component 1 (comp1)>Lithium-Ion Battery (liion) click Porous Electrode 2.
2
In the Settings window for Porous Electrode, locate the Porous Matrix Properties section.
3
In the εl text field, type epsl_pos.
Particle Intercalation 1
1
In the Model Builder window, expand the Porous Electrode 2 node, then click Particle Intercalation 1.
2
In the Settings window for Particle Intercalation, locate the Particle Transport Properties section.
3
In the rp text field, type rp_pos.
4
Locate the Particle Discretization section. Select the Fast assembly in particle dimension check box.
Porous Electrode Reaction 1
1
In the Model Builder window, click Porous Electrode Reaction 1.
2
In the Settings window for Porous Electrode Reaction, locate the Electrode Kinetics section.
3
In the i0,ref(T) text field, type i0ref_pos.
Initial Cell Charge Distribution 1
Change the initial battery setting from initial cell voltage to cell state-of-charge and enter the SOCcell_init parameter that is investigated.
1
In the Model Builder window, under Component 1 (comp1)>Lithium-Ion Battery (liion) click Initial Cell Charge Distribution 1.
2
In the Settings window for Initial Cell Charge Distribution, locate the Battery Cell Parameters section.
3
From the Initial battery cell setting list, choose Initial cell state-of-charge.
4
In the SOCcell,0 text field, type SOCcell_init.
Component 1 (comp1)
The cumulative energy input and output is calculated with a Global equation.
From the Home menu, choose Add Physics.
Add Physics
1
Go to the Add Physics window.
2
In the tree, select Mathematics>ODE and DAE Interfaces>Global ODEs and DAEs (ge).
3
Click Add to Component 1 in the window toolbar.
4
From the Home menu, choose Add Physics.
Cumulative Energy Output and Input
In the Settings window for Global ODEs and DAEs, type Cumulative Energy Output and Input in the Label text field.
Global Equations 1
1
In the Model Builder window, expand the Initial Cell Charge Distribution 1 node, then click Component 1 (comp1)>Cumulative Energy Output and Input (ge)>Global Equations 1.
2
In the Settings window for Global Equations, locate the Global Equations section.
3
4
Locate the Units section. Click  Define Dependent Variable Unit.
5
In the Dependent variable quantity table, enter the following settings:
6
Click  Define Source Term Unit.
7
In the Source term quantity table, enter the following settings:
Study 1
1
In the Model Builder window, click Study 1.
2
In the Settings window for Study, locate the Study Settings section.
3
Clear the Generate default plots check box.
4
Clear the Generate convergence plots check box.
Step 1: Current Distribution Initialization
Shut off solving for the Cumulative Energy Density in the first study step.
1
In the Model Builder window, expand the Study 1 node, then click Step 1: Current Distribution Initialization.
2
In the Settings window for Current Distribution Initialization, locate the Physics and Variables Selection section.
3
In the table, clear the Solve for check box for Cumulative Energy Output and Input (ge).
Step 2: Time Dependent
Specify the times of interest to store in the solution in the times list.
1
In the Model Builder window, click Step 2: Time Dependent.
2
In the Settings window for Time Dependent, locate the Study Settings section.
3
In the Output times text field, type range(0,1,9) 9.999 10 10.001 range(11,1,19) 19.999 20 20.001 range(21,1,30).
4
From the Tolerance list, choose User controlled.
5
In the Relative tolerance text field, type 1e-3.
Parametric Sweep
The polarization in the pulse gives an indication of the rate capability of the battery cell. Set a parametric sweep to vary the three parameters.
1
In the Study toolbar, click  Parametric Sweep.
2
In the Settings window for Parametric Sweep, locate the Study Settings section.
3
4
5
6
7
8
Solution 1 (sol1)
1
In the Study toolbar, click  Show Default Solver.
2
In the Model Builder window, expand the Solution 1 (sol1) node, then click Time-Dependent Solver 1.
3
In the Settings window for Time-Dependent Solver, click to expand the Absolute Tolerance section.
4
From the Tolerance method list, choose Manual.
Strict time stepping improves convergence for this model.
5
Click to expand the Time Stepping section. From the Steps taken by solver list, choose Strict.
6
In the Study toolbar, click  Compute.
High Current Pulse
1
In the Model Builder window, under Study 1>Solver Configurations click Parametric Solutions 1 (sol3).
2
In the Settings window for Solution, type High Current Pulse in the Label text field.
Results
Current
Plot the current profile of the pulse.
1
In the Home toolbar, click  Add Plot Group and choose 1D Plot Group.
2
In the Settings window for 1D Plot Group, type Current in the Label text field.
3
Locate the Data section. From the Dataset list, choose Study 1/High Current Pulse (sol3).
4
From the Parameter selection (SOCcell_init, rp_pos, epsl_pos) list, choose First.
5
Locate the Plot Settings section. Select the x-axis label check box.
6
7
Select the y-axis label check box.
8
Global 1
1
Right-click Current and choose Global.
2
In the Settings window for Global, click Replace Expression in the upper-right corner of the y-Axis Data section. From the menu, choose Component 1 (comp1)>Definitions>Variables>I_pulse - 10 C pulse test - A.
3
Locate the y-Axis Data section. In the table, enter the following settings:
4
Click to expand the Legends section. Clear the Show legends check box.
5
In the Current toolbar, click  Plot.
Cell voltage during discharge pulse
Evaluate the polarization in the 10 s discharge period in the following plots.
1
In the Home toolbar, click  Add Plot Group and choose 1D Plot Group.
2
In the Settings window for 1D Plot Group, type Cell voltage during discharge pulse in the Label text field.
3
Locate the Data section. From the Dataset list, choose Study 1/High Current Pulse (sol3).
4
From the Time selection list, choose From list. In the Times (s) list, choose all times from 0 to 19.999.
5
Click to expand the Title section. From the Title type list, choose None.
6
Locate the Plot Settings section. Select the x-axis label check box.
7
8
Select the y-axis label check box.
9
Global 1
1
Right-click Cell voltage during discharge pulse and choose Global.
2
In the Settings window for Global, click Replace Expression in the upper-right corner of the y-Axis Data section. From the menu, choose Component 1 (comp1)>Definitions>Variables>Ecell - Battery cell voltage - V.
3
Locate the Legends section. From the Legends list, choose Evaluated.
4
In the Legend text field, type SOC0=eval(SOCcell_init), rp_pos=eval(rp_pos) m, epsl_pos=eval(epsl_pos).
Global 2
1
Right-click Global 1 and choose Duplicate.
2
In the Settings window for Global, locate the Data section.
3
From the Dataset list, choose Study 1/High Current Pulse (sol3).
4
From the Parameter selection (SOCcell_init, rp_pos, epsl_pos) list, choose From list.
5
In the Parameter values (SOCcell_init,rp_pos (m),epsl_pos) list, choose 1: SOCcell_init=0.6, rp_pos=2E-6 m, epsl_pos=0.4 and 2: SOCcell_init=0.4, rp_pos=2E-6 m, epsl_pos=0.4.
6
From the Time selection list, choose From list. In the Times (s) list, choose all times from 0 to 19.999.
7
Click Replace Expression in the upper-right corner of the y-Axis Data section. From the menu, choose Component 1 (comp1)>Definitions>Variables>EOCVcell - Open-circuit cell voltage, coulombic - V.
8
Click to expand the Coloring and Style section. Find the Line style subsection. From the Line list, choose Dashed.
9
Locate the Legends section. From the Legends list, choose Manual.
10
Cell voltage during discharge pulse
1
In the Model Builder window, click Cell voltage during discharge pulse.
2
In the Settings window for 1D Plot Group, locate the Legend section.
3
From the Position list, choose Lower right.
4
In the Cell voltage during discharge pulse toolbar, click  Plot.
Positive potential during discharge pulse
1
Right-click Cell voltage during discharge pulse and choose Duplicate.
2
In the Settings window for 1D Plot Group, type Positive potential during discharge pulse in the Label text field.
3
Locate the Plot Settings section. In the y-axis label text field, type Potential (V).
Global 1
1
In the Model Builder window, expand the Positive potential during discharge pulse node, then click Global 1.
2
In the Settings window for Global, click Replace Expression in the upper-right corner of the y-Axis Data section. From the menu, choose Component 1 (comp1)>Definitions>Variables>Epos - Positive electrode potential - V.
Global 2
1
In the Model Builder window, click Global 2.
2
In the Settings window for Global, click Replace Expression in the upper-right corner of the y-Axis Data section. From the menu, choose Component 1 (comp1)>Definitions>Variables>EOCPpos - Open-circuit potential in positive electrode, coulombic - V.
3
In the Positive potential during discharge pulse toolbar, click  Plot.
Negative potential during discharge pulse
1
In the Model Builder window, right-click Positive potential during discharge pulse and choose Duplicate.
2
In the Settings window for 1D Plot Group, type Negative potential during discharge pulse in the Label text field.
Global 1
1
In the Model Builder window, expand the Negative potential during discharge pulse node, then click Global 1.
2
In the Settings window for Global, click Replace Expression in the upper-right corner of the y-Axis Data section. From the menu, choose Component 1 (comp1)>Definitions>Variables>Eneg - Negative electrode potential - V.
Global 2
1
In the Model Builder window, click Global 2.
2
In the Settings window for Global, click Replace Expression in the upper-right corner of the y-Axis Data section. From the menu, choose Component 1 (comp1)>Definitions>Variables>EOCPneg - Open-circuit potential in negative electrode, coulombic - V.
Negative potential during discharge pulse
1
In the Model Builder window, click Negative potential during discharge pulse.
2
In the Settings window for 1D Plot Group, locate the Legend section.
3
From the Position list, choose Middle right.
4
In the Negative potential during discharge pulse toolbar, click  Plot.
Polarization during discharge pulse
1
In the Model Builder window, right-click Cell voltage during discharge pulse and choose Duplicate.
2
In the Settings window for 1D Plot Group, type Polarization during discharge pulse in the Label text field.
3
Locate the Plot Settings section. In the y-axis label text field, type Polarization (V).
Global 1
1
In the Model Builder window, expand the Polarization during discharge pulse node, then click Global 1.
2
In the Settings window for Global, click Replace Expression in the upper-right corner of the y-Axis Data section. From the menu, choose Component 1 (comp1)>Definitions>Variables>Total_polarization - Total battery cell polarization - V.
Global 2
In the Model Builder window, right-click Global 2 and choose Disable.
Polarization during discharge pulse
1
In the Model Builder window, click Polarization during discharge pulse.
2
In the Settings window for 1D Plot Group, locate the Legend section.
3
From the Position list, choose Upper right.
4
In the Polarization during discharge pulse toolbar, click  Plot.
Internal resistance
Calculate the internal resistance in the different battery designs at the end of the 10 s 10C discharge.
1
In the Results toolbar, click  Global Evaluation.
2
In the Settings window for Global Evaluation, type Internal resistance in the Label text field.
3
Locate the Data section. From the Dataset list, choose Study 1/High Current Pulse (sol3).
4
From the Time selection list, choose From list.
5
In the Times (s) list, select 10.
6
Locate the Expressions section. Click  Clear Table.
7
8
Click  Evaluate.
Cell voltage during discharge pulse
Investigate the charge neutral pulse.
Cell voltage during pulse
1
In the Model Builder window, right-click Cell voltage during discharge pulse and choose Duplicate.
2
In the Settings window for 1D Plot Group, type Cell voltage during pulse in the Label text field.
3
Locate the Data section. From the Time selection list, choose All.
Global 2
1
In the Model Builder window, expand the Cell voltage during pulse node, then click Global 2.
2
In the Settings window for Global, locate the Data section.
3
From the Time selection list, choose All.
Cell voltage during pulse
1
In the Model Builder window, click Cell voltage during pulse.
2
In the Cell voltage during pulse toolbar, click  Plot.
Energy efficiency
Calculate the energy efficiency.
1
In the Results toolbar, click  Global Evaluation.
2
In the Settings window for Global Evaluation, type Energy efficiency in the Label text field.
3
Locate the Data section. From the Dataset list, choose Study 1/High Current Pulse (sol3).
4
From the Time selection list, choose Last.
5
From the Table columns list, choose Outer solutions.
6
Locate the Expressions section. Click  Clear Table.
7
8
Click  Evaluate.