PDF

Nonlinear Propagation of a Cylindrical Wave — Verification Model
Introduction
The linear or small acoustic perturbation theory is in most of the cases sufficient to describe the acoustic phenomena taking place in a particular industrial application. However, when the intensity of sound reaches higher levels, for example, in the majority of the medical ultrasound applications, the small perturbation theory becomes inadequate. In this case, one speaks of the propagation of finite amplitude sound waves. This approach takes into consideration the nonlinear effects that are due to the energy transfer from lower to higher harmonics. The local effective speed of sound becomes larger in the regions of higher sound pressure, which results in distortion of the wave profile and in the end leads to shocks.
The nonlinear effects can be put into two categories: local and cumulative effects. The former usually become negligible once the propagation distance becomes much greater than a wavelength; see Ref. 1. Thus the cumulative effects dominate the local ones under the assumption of progressive waves.
It is obvious that the superposition principle is in general not applicable while modeling nonlinear phenomena. Therefore, a transient analysis is necessary to account for the cumulative distortion along with the wave propagation.
This example shows how to model nonlinear propagation of finite-amplitude acoustic waves in fluids using the Nonlinear Pressure Acoustics, Time Explicit physics interface of the Acoustics Module. The interfaces solves the system of nonlinear acoustic equations in the form of a hyperbolic conservation law, see Ref. 2, using the discontinuous Galerkin finite element method (dG-FEM) and explicit time integration scheme. The computed numerical solution for the nonlinear propagation of a cylindrical wave is compared to the analytical solution available before the shock formation.
Model Definition
Consider a finite amplitude acoustic wave propagating in a lossless media in the absence of volume sources. The system of governing equations implemented in the Nonlinear Pressure Acoustics, Time Explicit interface, written in the dimensionless form, reads
(1)
where p is the acoustic pressure, u is the acoustic particle velocity, and β is the coefficient of nonlinearity. The dimensionless form means that the time, distance, and velocity are scaled to the period, wavelength, and speed of sound, respectively. It is clear that Equation 1 has the form of a hyperbolic conservation law Ref. 3.
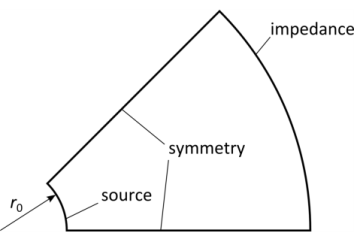
Let a cylindrical wave be induced by an acoustic pressure signal p(t) = P0sin(2πt) prescribed on a circle of the radius r0. Because of the circular symmetry of the source, the computational domain may be reduced to a circular sector with an arbitrary central angle. In this model, the sector has the angle of 45° as shown in Figure 1.
Figure 1: Model geometry.
An impedance boundary condition is imposed on the outer boundary to suppress undesirable reflections.
The described problem has an analytical solution (see Ref. 1). For the given excitation the dimensionless form of the analytical solution reads
(2),
where τ = t - (r - r0) is the retarded time and . Equation 2 is valid for the radii r ≤ rsh, where rsh = r0(1 + 1/(4πβP0r0))2 is the shock formation distance.
Results and Discussion
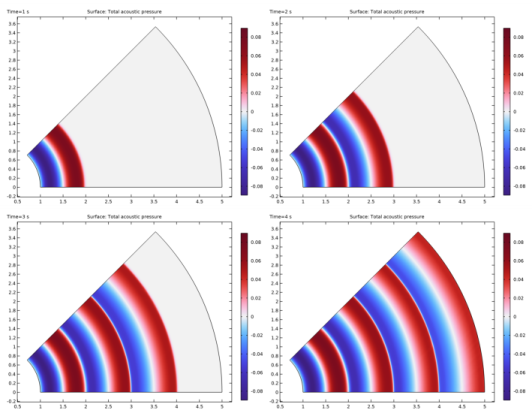
The evolution of the wave traveling from the source is illustrated in Figure 2. The nonlinear behavior becomes more distinct as the distance from the source increases. These are results of the cumulative nonlinear effects. The distortion of the waveform increases with the distance, in the end leading to the formation of shocks, which can be seen as a very sharp transition from the positive (red) to the negative (blue) acoustic pressure closer to the outer boundary.
Figure 2: Nonlinear propagation of the cylindrical wave at the times t = 1, 2, 3, and 4.
The formation of shocks is seen in Figure 3. Initially, the waveform distortion is caused by the dependence of local propagation speed on the acoustic pressure. The peaks of the wave travel faster than the troughs, and the waveform takes the shock wave structure after the shock formation (the green vertical line in Figure 3).
Figure 3: Acoustic pressure along the radial line at the end of the computation.
The distortion of the waveform results in the generation of higher harmonic components. The further the wave travels, the more energy is transferred to the higher harmonic components from the fundamental frequency of the harmonic source signal. This effect is demonstrated in Figure 4 which shows the frequency spectra of the acoustic pressure on the inner (source) and the outer (impedance) boundaries. It is seen that the signal at the source boundary has no frequency components other than the fundamental one. On the other hand, when the wave reaches the outer boundary, the contribution of the higher-order harmonics becomes distinct.
The model solution is compared to the analytical solution obtained from solving nonlinear Equation 2. The results are depicted in Figure 5. There is a good match between the numerical and the analytical solution in both amplitude and phase.
Figure 4: Frequency spectrum of the acoustic pressure signal on the inner and the outer boundaries.
Figure 5: Comparison of model solution (blue) with analytical solution (green) at r = 0.7rsh.
Notes About the COMSOL Implementation
Shock Limiter and Discretization
In this model, the outer radius of the computational domain is chosen to be larger than the shock formation distance rsh and therefore the traveling wave will endure shock discontinuities at the distances r ≥ rsh. The treatment of solution discontinuities requires special techniques. One of them is the WENO Limiter (Weighted Essentially Non-Oscillatory) available in the Nonlinear Pressure Acoustic, Time Explicit physics interface. The use of the TVB Troubled cell indicator makes it possible to identify the cells where WENO limiting is needed.
The WENO Limiter does not support discretization orders larger than one. Thus the default Quartic discretization has to be changed to Linear.
Mesh and Time Explicit Solver
Solving wave propagation problems in the time domain has some requirements on both spatial and temporal resolution of the wave pattern. The mesh has to be fine enough to resolve the frequency content of the signal, that is, the specified number of the higher-order harmonics, N. For the linear discretization, the proper accuracy is achieved when the maximum mesh element size does not exceed 1/10 of the minimum wavelength. That is, hmax  1/(10N).
The Nonlinear Pressure Acoustic, Time Explicit physics is based on dG-FEM and uses an explicit time integration schemes. The time step is supposed to obey the CFL condition to ensure the stability of the time integration method. That is, Δ hmin/cmax, where hmin is the minimum mesh element size and cmax is the maximum wave propagation speed. The latter locally depends on the acoustic pressure .
The computation of discontinuous solutions requires that a Strong Stability Preserving (SSP) Runge–Kutta method be used. The third order SSP Runge–Kutta method is achievable by changing the Order of the Runge–Kutta method from the default 4 to 3. Since the local speed of sound is not a constant, it is reasonable to enable the option Update time step to adjust the time step for a better resolution of the solution.
References
1. M.F. Hamilton and D.T. Blackstock, eds., Nonlinear Acoustics, Academic Press, San Diego, CA, 1998.
2. M.A. Diaz, M.A. Solovchuk, and T.W.H. Sheu, “A conservative numerical scheme for modeling nonlinear acoustic propagation in thermoviscous homegeneous media”, J. Comp. Phys., vol. 363, 2018.
3. E.F. Toro, Riemann Solvers and Numerical Methods for Fluid Dynamics. A Practical Introduction, 3rd Ed., Springer-Verlag, Berlin, 2009.
Application Library path: Acoustics_Module/Nonlinear_Acoustics/nonlinear_cylindrical_wave
Modeling Instructions
From the File menu, choose New.
New
In the New window, click  Model Wizard.
Model Wizard
1
In the Model Wizard window, click  2D.
2
In the Select Physics tree, select Acoustics>Ultrasound>Nonlinear Pressure Acoustics, Time Explicit (nate).
3
Click Add.
4
Click  Study.
5
In the Select Study tree, select General Studies>Time Dependent.
6
Global Definitions
Parameters 1
1
In the Model Builder window, under Global Definitions click Parameters 1.
2
In the Settings window for Parameters, locate the Parameters section.
3
Click  Load from File.
4
Before setting up the physics, change the unit system to be dimensionless.
Root
1
In the Model Builder window, click the root node.
2
In the root node’s Settings window, locate the Unit System section.
3
From the Unit system list, choose None.
Geometry 1
Circle 1 (c1)
1
In the Geometry toolbar, click  Circle.
2
In the Settings window for Circle, locate the Size and Shape section.
3
In the Radius text field, type r0.
4
In the Sector angle text field, type 45.
5
Click  Build Selected.
Circle 2 (c2)
1
Right-click Circle 1 (c1) and choose Duplicate.
2
In the Settings window for Circle, locate the Size and Shape section.
3
In the Radius text field, type 5*r0.
4
Click  Build Selected.
Difference 1 (dif1)
1
In the Geometry toolbar, click  Booleans and Partitions and choose Difference.
2
3
In the Settings window for Difference, locate the Difference section.
4
Find the Objects to subtract subsection. Click to select the  Activate Selection toggle button.
5
6
Click  Build All Objects.
7
Click the  Zoom Extents button in the Graphics toolbar.
Since the outer radius is larger than the shock formation radius, shocks form as the wave passes rsh. Therefore it is required to turn on the Limiter to resolve the shocks.
1
Click the  Show More Options button in the Model Builder toolbar.
2
In the Show More Options dialog box, in the tree, select the check box for the node Physics>Stabilization.
3
Nonlinear Pressure Acoustics, Time Explicit (nate)
1
In the Model Builder window, under Component 1 (comp1) click Nonlinear Pressure Acoustics, Time Explicit (nate).
2
In the Settings window for Nonlinear Pressure Acoustics, Time Explicit, click to expand the Limiter section.
3
From the Limiter list, choose WENO.
The WENO Limiter does not support discretization orders larger than one. Thus the default Quartic discretization has to be changed to Linear.
4
Click to expand the Discretization section. From the Element order list, choose Linear.
Nonlinear Pressure Acoustics, Time Explicit Model 1
1
In the Model Builder window, under Component 1 (comp1)>Nonlinear Pressure Acoustics, Time Explicit (nate) click Nonlinear Pressure Acoustics, Time Explicit Model 1.
2
In the Settings window for Nonlinear Pressure Acoustics, Time Explicit Model, locate the Pressure Acoustics Model section.
3
From the c list, choose User defined. In the associated text field, type 1.
4
From the ρ list, choose User defined. In the associated text field, type 1.
5
Locate the Coefficient of Nonlinearity section. From the β list, choose User defined.
6
Pressure 1
1
In the Physics toolbar, click  Boundaries and choose Pressure.
2
3
In the Settings window for Pressure, locate the Pressure section.
4
In the p0(t) text field, type P0*sin(2*pi*t).
Impedance 1
1
In the Physics toolbar, click  Boundaries and choose Impedance.
2
3
In the Settings window for Impedance, locate the Impedance section.
4
From the Pressure-particle velocity relation list, choose Second order.
Mesh 1
Free Triangular 1
In the Mesh toolbar, click  Free Triangular.
Size
1
In the Model Builder window, click Size.
2
In the Settings window for Size, locate the Element Size section.
3
Click the Custom button.
When the linear discretization is used, the mesh should have at least 10 elements per wavelength to resolve the wave pattern.
4
Locate the Element Size Parameters section. In the Maximum element size text field, type 1/10/N.
5
Click  Build All.
Study 1 - Numerical
1
In the Model Builder window, click Study 1.
2
In the Settings window for Study, type Study 1 - Numerical in the Label text field.
Solution 1 (sol1)
1
In the Study toolbar, click  Show Default Solver.
2
In the Model Builder window, expand the Solution 1 (sol1) node, then click Time-Explicit Solver 1.
3
In the Settings window for Time-Explicit Solver, locate the General section.
4
From the Order list, choose 3.
This ensures that the third-order Strong Stability-Preserving (SSP) Runge-Kutta solver will be used, which is required for problems with discontinuous solutions (shocks).
5
From the Update time step list, choose Manual.
Step 1: Time Dependent
1
In the Model Builder window, under Study 1 - Numerical click Step 1: Time Dependent.
2
In the Settings window for Time Dependent, locate the Study Settings section.
3
In the Output times text field, type range(0, 1/50, 5).
4
In the Study toolbar, click  Compute.
Results
Acoustic Pressure (nate)
First, inspect the propagation of the wave by looking at its profile at various times. The results should look like the ones in Figure 2.
Then, plot the acoustic pressure along the radial line to see the formation of shocks.
Acoustic Pressure, Line
1
In the Home toolbar, click  Add Plot Group and choose 1D Plot Group.
2
In the Settings window for 1D Plot Group, click to expand the Title section.
3
From the Title type list, choose Manual.
4
In the Title text area, type Acoustic pressure along radial line.
5
Locate the Data section. From the Time selection list, choose Last.
6
In the Label text field, type Acoustic Pressure, Line.
Line Graph 1
1
In the Acoustic Pressure, Line toolbar, click  Line Graph.
2
3
In the Settings window for Line Graph, locate the x-Axis Data section.
4
From the Parameter list, choose Expression.
5
In the Expression text field, type x.
6
Click to expand the Coloring and Style section. In the Width text field, type 2.
Line Graph 2
1
Right-click Line Graph 1 and choose Duplicate.
2
In the Settings window for Line Graph, locate the x-Axis Data section.
3
In the Expression text field, type r_sh.
4
In the Acoustic Pressure, Line toolbar, click  Plot.
5
Click to expand the Legends section. Select the Show legends check box.
6
From the Legends list, choose Manual.
7
8
In the Acoustic Pressure, Line toolbar, click  Plot.
Line Graph 1
1
In the Model Builder window, click Line Graph 1.
2
The result should look like the one in Figure 3.
Acoustic Pressure, Frequency Spectrum
1
In the Home toolbar, click  Add Plot Group and choose 1D Plot Group.
2
In the Settings window for 1D Plot Group, type Acoustic Pressure, Frequency Spectrum in the Label text field.
3
Locate the Data section. From the Time selection list, choose Interpolated.
4
In the Times (s) text field, type range(4, 1/50, 5).
5
Locate the Title section. From the Title type list, choose Manual.
6
In the Title text area, type Acoustic pressure, frequency spectrum.
Point Graph 1
1
Right-click Acoustic Pressure, Frequency Spectrum and choose Point Graph.
2
3
In the Settings window for Point Graph, locate the x-Axis Data section.
4
From the Parameter list, choose Discrete Fourier transform.
5
From the Show list, choose Frequency spectrum.
6
From the Scale list, choose Multiply by sampling period.
7
Select the Frequency range check box.
8
In the Maximum text field, type N.
9
Click to expand the Coloring and Style section. Find the Line style subsection. From the Line list, choose None.
10
Find the Line markers subsection. From the Marker list, choose Point.
11
From the Positioning list, choose In data points.
12
Click to expand the Legends section. Select the Show legends check box.
13
From the Legends list, choose Manual.
14
Point Graph 2
1
Right-click Point Graph 1 and choose Duplicate.
2
In the Settings window for Point Graph, locate the Selection section.
3
Click  Clear Selection.
4
5
Locate the Coloring and Style section. Find the Line markers subsection. From the Marker list, choose Asterisk.
6
Locate the Legends section. In the table, enter the following settings:
7
In the Acoustic Pressure, Frequency Spectrum toolbar, click  Plot.
The result should look like the one in Figure 4.
Add Physics
1
In the Home toolbar, click  Add Physics to open the Add Physics window.
2
Go to the Add Physics window.
3
In the tree, select Mathematics>ODE and DAE Interfaces>Global ODEs and DAEs (ge).
4
Find the Physics interfaces in study subsection. In the table, clear the Solve check box for Study 1 - Numerical.
5
Click Add to Component 1 in the window toolbar.
6
In the Home toolbar, click  Add Physics to close the Add Physics window.
Global ODEs and DAEs (ge)
Global Equations 1
1
In the Model Builder window, under Component 1 (comp1)>Global ODEs and DAEs (ge) click Global Equations 1.
2
In the Settings window for Global Equations, locate the Global Equations section.
3
Add Study
1
In the Home toolbar, click  Add Study to open the Add Study window.
2
Go to the Add Study window.
3
Find the Physics interfaces in study subsection. In the table, clear the Solve check box for Nonlinear Pressure Acoustics, Time Explicit (nate).
4
Find the Studies subsection. In the Select Study tree, select General Studies>Stationary.
5
Click Add Study in the window toolbar.
6
In the Home toolbar, click  Add Study to close the Add Study window.
Study 2 - Analytical
1
In the Model Builder window, click Study 2.
2
In the Settings window for Study, type Study 2 - Analytical in the Label text field.
3
Locate the Study Settings section. Clear the Generate default plots check box.
Parametric Sweep
1
In the Study toolbar, click  Parametric Sweep.
2
In the Settings window for Parametric Sweep, locate the Study Settings section.
3
4
5
In the Study toolbar, click  Compute.
Results
Cut Point 2D 1
1
In the Results toolbar, click  Cut Point 2D.
2
In the Settings window for Cut Point 2D, locate the Point Data section.
3
In the x text field, type a*r_sh.
4
In the y text field, type 0.
Acoustic Pressure, Point
1
In the Results toolbar, click  1D Plot Group.
2
In the Settings window for 1D Plot Group, type Acoustic Pressure, Point in the Label text field.
3
Locate the Title section. From the Title type list, choose Manual.
4
In the Title text area, type Acoustic pressure at point.
5
Locate the Data section. From the Dataset list, choose None.
Point Graph 1
1
In the Acoustic Pressure, Point toolbar, click  Point Graph.
2
In the Settings window for Point Graph, locate the Data section.
3
From the Dataset list, choose Cut Point 2D 1.
4
Locate the Coloring and Style section. In the Width text field, type 2.
5
Locate the Legends section. Select the Show legends check box.
6
From the Legends list, choose Manual.
7
Acoustic Pressure, Point
In the Model Builder window, click Acoustic Pressure, Point.
Global 1
1
In the Acoustic Pressure, Point toolbar, click  Global.
2
In the Settings window for Global, locate the Data section.
3
From the Dataset list, choose Study 2 - Analytical/Solution 2 (sol2).
4
Locate the x-Axis Data section. From the Parameter list, choose Expression.
Make the retarded time parameter match the actual time by adding the information about the signal traveling history from the source to the point arsh.
5
In the Expression text field, type tau + (a*r_sh - r0).
6
Click to expand the Coloring and Style section. In the Width text field, type 2.
7
In the Acoustic Pressure, Point toolbar, click  Plot.
The result should look like the one in Figure 5.