PDF

Acoustic-Structure Interaction
Introduction
This model provides a tutorial on modeling the interaction of sound with elastic, solid structures by using a specific example of an elastic cylinder in water. The sound will cause movement of the solid cylinder, which in turn will induce new sound waves in the air; thus, full bidirectional coupling between the acoustic medium (water) and the cylinder is required to realistically simulate this situation.
This model is similar to the interaction of acoustic signals (sound) with most everyday objects: Liquid or gas acoustics coupled to structural objects have application in many engineering fields, for example, loudspeakers, acoustic sensors, nondestructive testing, or medical ultrasound diagnostics of the human body.
The intent with this tutorial model is to illustrate the modeling process rather than to provide an exhaustive illustration of the acoustic-solid interaction capabilities of COMSOL.
Model Definition
This model simulates the behavior of a solid cylinder in an water domain with an incident acoustic wave in the water. The object’s walls are impacted by the acoustic pressure. The model calculates the frequency response from the solid and then feeds this information back to the acoustics domain so that it can analyze the resulting wave pattern. As such, the model is a good example of a scattering acoustic-solid interaction problem.
Figure 1: Geometric setup of an aluminum cylinder immersed in water.
To set up the model, use the Acoustic-Solid Interaction, Frequency Domain multiphysics interface. This interface involves two physics interfaces: Solid Mechanics and Pressure Acoustics, Frequency Domain. It also sets up the Acoustic-Structure Boundary multiphysics coupling.
Figure 1 illustrates the aluminum cylinder immersed in water. The incident wave is 60 kHz, in the ultrasound region. The cylinder is cm in height and has a diameter of 1 cm. The water acoustic domain is truncated as a sphere with a reasonably large diameter. What drives the system is an incident plane wave from the surroundings into the spherical boundary. The harmonic acoustic pressure in the water on the surface of the cylinder acts as a boundary load in the 3D solid to ensure continuity in pressure. The model calculates harmonic displacements and stresses in the solid cylinder, and it then uses the normal acceleration of the solid surface in the acoustics domain boundary to ensure continuity in acceleration.
Domain Equations
The default Pressure Acoustics feature models harmonic sound waves in the water domain by means of the Helmholtz equation for sound pressure:
Where p is the pressure (SI unit: N/m2), ρc is the density (kg/m3), ω is the angular frequency (SI unit: rad/s), and cc is the speed of sound (SI unit: m/s). Note that both the density and the speed of sound can be complex valued (hence the subscript “c”) in order model fluids with dissipating properties. In this model they are real valued as no damping is modeled.
cc
f = ω/2π
To calculate the harmonic stresses and strains in the solid cylinder for a frequency-response analysis, use the default Linear Elastic Material model feature under the Solid Mechanics interface. The material data comes from the built-in database for Aluminum 3003-H18.
Boundary Conditions
Outer Perimeter
On the outer spherical perimeter of the water domain (Figure 1) specify an incident plane wave to represent an incoming sound wave. A superimposed spherical wave is allowed to travel out of the system as a response from the cylinder. In the Pressure Acoustics, Frequency Domain interface you implement this scenario by using the prepared Spherical Wave Radiation boundary condition. Such boundary condition is useful when the surroundings are only a continuation of the domain.
p0
The incident wave direction k is controlled by the two angles 0 < θ π and 0 <  < 2π. The incident field is defined in the Incident Pressure Field subfeature.
Interface Cylinder-Water
The coupling between the fluid domain (pressure waves) and the solid is automatically done via the Acoustic-Structure Boundary multiphysics coupling. The automatic boundary condition sets the boundary load F (force/unit area) on the solid cylinder to
where ns is the outward-pointing unit normal vector seen from inside the solid domain. While on the fluid side the normal acceleration experienced by the fluid is set equal to the normal acceleration of the solid. Mathematically this means that
where na is the outward-pointing unit normal vector seen from inside the acoustics domain, and the normal acceleration an is equal to (na · u) ω2, where u is the calculated harmonic-displacement vector of the solid structure.
Hard-Wall Comparison
As a reference you can also study a simpler model where the solid interface is regarded as a hard wall. This implies that the cylinder will not be affected by sound, but its presence will nonetheless affect how the sound is distributed. In the model this is achieved by setting a fixed constraint on all the solid boundaries, that is, u = 0. This reduces the above condition (an = 0) to the sound hard boundary condition
Results and Discussion
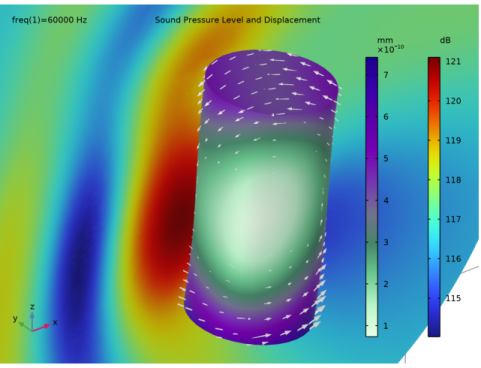
Figure 2 displays the sound pressure as a slice plot. It is clear from which direction the sound wave propagates into the domain. The values of the deformation are very small, but the acceleration is large enough to have an impact on the sound waves.
Figure 2: Displacement of the cylinder and the sound-pressure plot (dB) of the acoustic waves in the coupled problem. The arrow lengths are proportional to the surface acceleration, which is a direct measure of the sound-pressure interaction between the water and the cylinder.
Figure 3 shows a comparison between the hard-wall example and the full aluminum solid model. Near the cylinder wall the plot shows that the sound pressure level (SPL) is higher on the upstream side for the hard-wall case than for the aluminum model. This is also the case on the downstream side, where the SPL for the hard-wall model is higher than for the aluminum model. This shows that the hard wall reflects more than the aluminum case. The conclusion is that the mechanical properties of the metal object have an impact on the acoustic signature.
Figure 3: Sound pressure level on impact and on the shadow side of the cylinder.
Application Library path: Acoustics_Module/Tutorials,_Pressure_Acoustics/acoustic_structure
Modeling Instructions
From the File menu, choose New.
New
In the New window, click  Model Wizard.
Model Wizard
1
In the Model Wizard window, click  3D.
2
In the Select Physics tree, select Acoustics>Acoustic-Structure Interaction>Acoustic-Solid Interaction, Frequency Domain.
3
Click Add.
4
Click  Study.
5
In the Select Study tree, select General Studies>Frequency Domain.
6
Global Definitions
Parameters 1
You may either add the parameters manually or load them from a text file.
1
In the Model Builder window, under Global Definitions click Parameters 1.
2
In the Settings window for Parameters, locate the Parameters section.
3
Click  Load from File.
4
To add parameters manually, you can do as follows.
5
Geometry 1
1
In the Model Builder window, under Component 1 (comp1) click Geometry 1.
2
In the Settings window for Geometry, locate the Units section.
3
From the Length unit list, choose mm.
Cylinder 1 (cyl1)
1
In the Geometry toolbar, click  Cylinder.
2
In the Settings window for Cylinder, locate the Size and Shape section.
3
In the Radius text field, type 5.
4
In the Height text field, type 20.
5
Locate the Position section. In the z text field, type -10.
6
Click  Build Selected.
Sphere 1 (sph1)
1
In the Geometry toolbar, click  Sphere.
2
In the Settings window for Sphere, locate the Size section.
3
In the Radius text field, type R.
4
Click  Build Selected.
5
Click the  Zoom Extents button in the Graphics toolbar.
To see the interior:
6
Click the  Wireframe Rendering button in the Graphics toolbar.
Definitions
Next, define a number of selections as sets of geometric entities to use when setting up the model.
Fluid Domain
1
In the Definitions toolbar, click  Explicit.
2
In the Settings window for Explicit, type Fluid Domain in the Label text field.
3
Solid Domain
1
In the Definitions toolbar, click  Explicit.
2
In the Settings window for Explicit, type Solid Domain in the Label text field.
3
Radiation Boundaries
1
In the Definitions toolbar, click  Explicit.
2
In the Settings window for Explicit, type Radiation Boundaries in the Label text field.
3
Locate the Input Entities section. Select the All domains check box.
4
Locate the Output Entities section. From the Output entities list, choose Adjacent boundaries.
Solid Boundaries
1
In the Definitions toolbar, click  Explicit.
2
In the Settings window for Explicit, type Solid Boundaries in the Label text field.
3
4
Locate the Output Entities section. From the Output entities list, choose Adjacent boundaries.
Add Material
1
In the Home toolbar, click  Add Material to open the Add Material window.
2
Go to the Add Material window.
3
In the tree, select Built-in>Water, liquid.
4
Click Add to Component in the window toolbar.
5
In the tree, select Built-in>Aluminum 3003-H18.
6
Click Add to Component in the window toolbar.
7
In the Home toolbar, click  Add Material to close the Add Material window.
Materials
Water, liquid (mat1)
1
In the Model Builder window, under Component 1 (comp1)>Materials click Water, liquid (mat1).
2
In the Settings window for Material, locate the Geometric Entity Selection section.
3
From the Selection list, choose Fluid Domain.
Aluminum 3003-H18 (mat2)
1
In the Model Builder window, click Aluminum 3003-H18 (mat2).
2
In the Settings window for Material, locate the Geometric Entity Selection section.
3
From the Selection list, choose Solid Domain.
Now, set up the physics of the problem by defining the domain physics conditions and the boundary conditions.
Pressure Acoustics, Frequency Domain (acpr)
1
In the Model Builder window, under Component 1 (comp1) click Pressure Acoustics, Frequency Domain (acpr).
2
In the Settings window for Pressure Acoustics, Frequency Domain, locate the Domain Selection section.
3
From the Selection list, choose Fluid Domain.
4
Locate the Sound Pressure Level Settings section. From the Reference pressure for the sound pressure level list, choose Use reference pressure for water.
Spherical Wave Radiation 1
1
In the Physics toolbar, click  Boundaries and choose Spherical Wave Radiation.
2
In the Settings window for Spherical Wave Radiation, locate the Boundary Selection section.
3
From the Selection list, choose Radiation Boundaries.
Incident Pressure Field 1
1
In the Physics toolbar, click  Attributes and choose Incident Pressure Field.
2
In the Settings window for Incident Pressure Field, locate the Incident Pressure Field section.
3
In the p0 text field, type 1.
4
From the c list, choose From material.
5
From the Material list, choose Water, liquid (mat1).
6
Specify the ek vector as
Solid Mechanics (solid)
1
In the Model Builder window, under Component 1 (comp1) click Solid Mechanics (solid).
2
In the Settings window for Solid Mechanics, locate the Domain Selection section.
3
From the Selection list, choose Solid Domain.
Mesh
Proceed and generate the mesh using the Physics-controlled mesh functionality. The frequency controlling the maximum element size is per default taken From study. Set the desired Frequencies in the study step. In general, 5 to 6 second-order elements per wavelength are needed to resolve the waves. For more details, see Meshing (Resolving the Waves) in the Acoustics Module User’s Guide. In this model, we use 6 elements per wavelength; the default Automatic is to have 5.
Study 1 - Sound Hard Cylinder
1
In the Model Builder window, click Study 1.
2
In the Settings window for Study, type Study 1 - Sound Hard Cylinder in the Label text field.
3
Locate the Study Settings section. Clear the Generate default plots check box.
Step 1: Frequency Domain
1
In the Model Builder window, under Study 1 - Sound Hard Cylinder click Step 1: Frequency Domain.
2
In the Settings window for Frequency Domain, locate the Study Settings section.
3
In the Frequencies text field, type f.
Mesh 1
1
In the Model Builder window, under Component 1 (comp1) click Mesh 1.
2
In the Settings window for Mesh, locate the Pressure Acoustics, Frequency Domain (acpr) section.
3
From the Number of mesh elements per wavelength list, choose User defined.
4
5
Click  Build All.
6
Click the  Zoom Extents button in the Graphics toolbar.
7
Click the  Transparency button in the Graphics toolbar.
8
Click the  Transparency button in the Graphics toolbar to return to the default state.
Study 1 - Sound Hard Cylinder
Step 1: Frequency Domain
Disable the Solid Mechanics interface, which corresponds to the hard cylinder case.
1
In the Model Builder window, under Study 1 - Sound Hard Cylinder click Step 1: Frequency Domain.
2
In the Settings window for Frequency Domain, locate the Physics and Variables Selection section.
3
In the table, clear the Solve for check box for Solid Mechanics (solid).
4
In the table, clear the Solve for check box for Acoustic-Structure Boundary 1 (asb1).
5
In the Home toolbar, click  Compute.
Before visualizing this solution, include the structural analysis of the cylinder and compute the corresponding solution. You can do this by adding one more study.
Add Study
1
In the Home toolbar, click  Add Study to open the Add Study window.
2
Go to the Add Study window.
3
Find the Studies subsection. In the Select Study tree, select General Studies>Frequency Domain.
4
Click Add Study in the window toolbar.
5
In the Home toolbar, click  Add Study to close the Add Study window.
Study 2 - Aluminum Cylinder
1
In the Model Builder window, click Study 2.
2
In the Settings window for Study, type Study 2 - Aluminum Cylinder in the Label text field.
3
Locate the Study Settings section. Clear the Generate default plots check box.
Step 1: Frequency Domain
1
In the Model Builder window, under Study 2 - Aluminum Cylinder click Step 1: Frequency Domain.
2
In the Settings window for Frequency Domain, locate the Study Settings section.
3
In the Frequencies text field, type f.
4
In the Home toolbar, click  Compute.
Results
To reproduce the plot in Figure 3, which compares the sound pressure levels along a diameter in the propagation direction for the two cases, begin by defining datasets as follows.
Cut Line 3D 1
1
In the Results toolbar, click  Cut Line 3D.
2
In the Settings window for Cut Line 3D, locate the Line Data section.
3
In row Point 1, set X to -R*k1, Y to -R*k2, and Z to -R*k3.
4
In row Point 2, set X to R*k1, Y to R*k2, and Z to R*k3.
5
Cut Line 3D 2
1
Right-click Cut Line 3D 1 and choose Duplicate.
2
In the Settings window for Cut Line 3D, locate the Data section.
3
From the Dataset list, choose Study 2 - Aluminum Cylinder/Solution 2 (sol2).
Sound Pressure Level Along Propagation Direction
1
In the Results toolbar, click  1D Plot Group.
2
In the Settings window for 1D Plot Group, type Sound Pressure Level Along Propagation Direction in the Label text field.
3
Click to expand the Title section. From the Title type list, choose Label.
Line Graph 1
1
Right-click Sound Pressure Level Along Propagation Direction and choose Line Graph.
2
In the Settings window for Line Graph, locate the Data section.
3
From the Dataset list, choose Cut Line 3D 1.
4
Click Replace Expression in the upper-right corner of the y-Axis Data section. From the menu, choose Component 1 (comp1)>Pressure Acoustics, Frequency Domain>Pressure and sound pressure level>acpr.Lp_t - Total sound pressure level - dB.
5
Click to expand the Legends section. Locate the x-Axis Data section. From the Parameter list, choose Expression.
6
In the Expression text field, type x.
7
Locate the Legends section. Select the Show legends check box.
8
From the Legends list, choose Manual.
9
Line Graph 2
1
Right-click Line Graph 1 and choose Duplicate.
2
In the Settings window for Line Graph, locate the Data section.
3
From the Dataset list, choose Cut Line 3D 2.
4
Locate the Legends section. In the table, enter the following settings:
5
In the Sound Pressure Level Along Propagation Direction toolbar, click  Plot.
Finally, follow the instructions below to create the plot shown in Figure 2:
Sound Pressure Level and Displacement
1
In the Home toolbar, click  Add Plot Group and choose 3D Plot Group.
2
In the Settings window for 3D Plot Group, type Sound Pressure Level and Displacement in the Label text field.
3
Locate the Data section. From the Dataset list, choose Study 2 - Aluminum Cylinder/Solution 2 (sol2).
4
Locate the Plot Settings section. Clear the Plot dataset edges check box.
5
Locate the Color Legend section. Select the Show units check box.
6
Click to expand the Title section. From the Title type list, choose Label.
Surface 1
1
Right-click Sound Pressure Level and Displacement and choose Surface.
2
In the Settings window for Surface, click Replace Expression in the upper-right corner of the Expression section. From the menu, choose Component 1 (comp1)>Solid Mechanics>Displacement>solid.disp - Displacement magnitude - m.
3
Locate the Coloring and Style section. From the Color table list, choose AuroraBorealis.
Deformation 1
Right-click Surface 1 and choose Deformation.
Slice 1
1
In the Model Builder window, right-click Sound Pressure Level and Displacement and choose Slice.
2
In the Settings window for Slice, click Replace Expression in the upper-right corner of the Expression section. From the menu, choose Component 1 (comp1)>Pressure Acoustics, Frequency Domain>Pressure and sound pressure level>acpr.Lp_t - Total sound pressure level - dB.
3
Locate the Plane Data section. From the Plane list, choose ZX-planes.
4
From the Entry method list, choose Coordinates.
5
In the Y-coordinates text field, type 5.
Arrow Surface 1
1
Right-click Sound Pressure Level and Displacement and choose Arrow Surface.
2
In the Settings window for Arrow Surface, click Replace Expression in the upper-right corner of the Expression section. From the menu, choose Component 1 (comp1)>Solid Mechanics>Acceleration and velocity>solid.u_ttX,...,solid.u_ttZ - Acceleration.
3
Locate the Coloring and Style section. From the Arrow base list, choose Head.
4
Select the Scale factor check box.
5
6
Locate the Arrow Positioning section. In the Number of arrows text field, type 5000.
7
Locate the Coloring and Style section. From the Color list, choose White.
Sound Pressure Level and Displacement
1
In the Model Builder window, click Sound Pressure Level and Displacement.
2
In the Sound Pressure Level and Displacement toolbar, click  Plot.
3
Click the Zoom Box button in the Graphics toolbar and then use the mouse to zoom in.