PDF

Optically Anisotropic Waveguide
Introduction
Optical waveguides consist of a core with a high refractive index, surrounded by a cladding with a low refractive index. Thereby, due to total internal reflection, the mode is guided by the high-index core. The smaller the refractive index difference is between the core and the cladding, the more the mode extends into the cladding. For example, the tutorial called Directional Coupler demonstrates how to model a GaAs-based waveguide structure consisting of two closely spaced waveguide cores surrounded by a cladding.
For most waveguide structures, the optical properties for the core and the cladding are different. However, within each domain, the material properties are uniform and isotropic. This model demonstrates what happens when the material in the core exhibit anisotropy. Specifically, in this case, the electric displacement field is no longer parallel to the electric field. Instead, the electric displacement field D relates to the electric field E by a matrix-vector expression
(1),
where Dx, Dy, and Dz are the components of the electric displacement field D, ε0 is the vacuum permittivity, εrij is the relative permittivity tensor element for row index i and column index j, and Ex, Ey, and Ez are the components of the electric field E.
However, for all materials, you can find a coordinate system in which you only have nonzero diagonal elements in the permittivity tensor, whereas the off-diagonal elements are all zero. The three coordinate axes in this rotated coordinate system are the principal axes of the material and, correspondingly, the three values for the diagonal elements in the permittivity tensor are called the principal permittivities of the material.
There are basically two kinds of anisotropic crystals: uniaxial and biaxial crystals. With a suitable choice of coordinate system, where only the diagonal elements of the permittivity tensor are nonzero, uniaxial crystals are characterized by an extraordinary refractive index ne for waves polarized along the crystal’s optical axis and an ordinary refractive index no for waves polarized orthogonally to the crystal’s optical axis. So the diagonal elements of the relative permittivity in the rotated coordinate system are given by εrxx = εryy = (no)2, εrzz = (ne)2. However, for a biaxial crystal, all three principal permittivities are different.
Model Definition
In this model a uniaxial material will be used. Two cases will be considered — diagonal transverse anisotropy, where the crystal’s optical axis is oriented in an orthogonal Cartesian direction to the propagation direction of the waveguide, and off-diagonal longitudinal anisotropy, where the optical axis has a components both in the propagation direction and in the transverse direction. Here, for the diagonal transverse anisotropy, the extraordinary refractive index is defined in the x direction. For the off-diagonal longitudinal anisotropy case, the optical axis is defined in a direction 45 degrees from the z-axis in the yz-plane.
The ordinary refractive index is 1.52 and the extraordinary refractive index is 1.48.
A mode analysis is performed where the width and the thickness is parametrically swept from 0.5 μm to 4 μm. For each geometry, the effective index is solved for and plotted in a dispersion diagram. The results agree well with the results reported in Ref. 1.
Results and Discussion
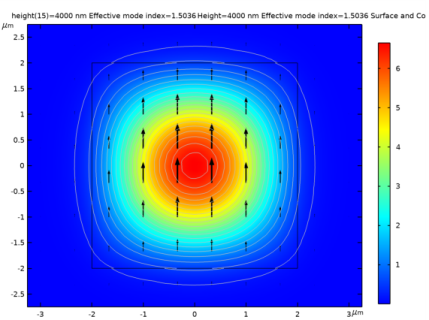
Figure 1 shows the power in the dominant mode Ey11 for diagonal transverse anisotropy. Here, the superscript denotes the dominant polarization direction and the first and second subscripts denote the number of peaks in the x and y direction, respectively.
Figure 1: The power in the propagation direction (out-of-plane) for the dominant mode, Ey11. The arrows show that the mode is polarized in the y direction.
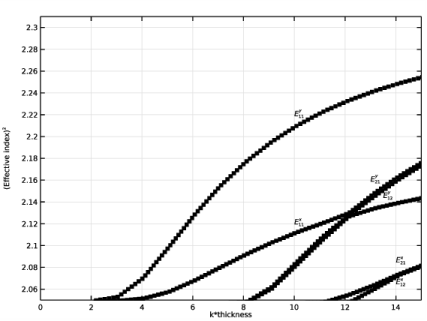
Figure 2 shows the dispersion curves for the lowest order modes for the case of diagonal transverse anisotropy. The dispersion curves show good agreement with those in Fig. 3 of Ref. 1.
Figure 2: Dispersion curves for the lowest order modes for the diagonal transverse anisotropic case.
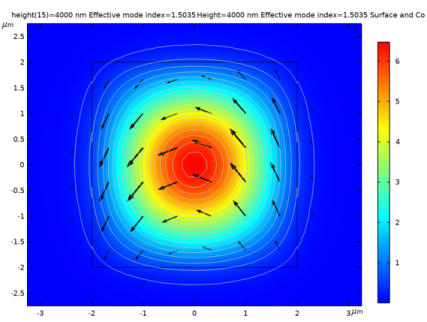
Figure 3 shows the power in the dominant mode Ex11 for off-diagonal longitudinal anisotropy. As seen from the plot, the polarization is not uniform for this type of anisotropy.
Figure 4 shows the dispersion curves for off-diagonal longitudinal anisotropy. These results show good agreement with Fig. 8 in Ref. 1.
Figure 3: The lowest order mode, Ex11, for off-diagonal longitudinal anisotropy.
Figure 4: Dispersion curves for the lowest order modes for off-diagonal longitudinal anisotropy.
Reference
1. M. Koshiba, K. Hayata, and M. Suzuki, “Finite-element solution of anisotropic waveguides with arbitrary tensor permittivity,” J. Lightwave Technol., vol. LT-4, p. 121, 1986.
Application Library path: Wave_Optics_Module/Verification_Examples/optically_anisotropic_waveguide
Modeling Instructions
From the File menu, choose New.
New
In the New window, click  Model Wizard.
Model Wizard
1
In the Model Wizard window, click  2D.
2
In the Select Physics tree, select Optics>Wave Optics>Electromagnetic Waves, Frequency Domain (ewfd).
3
Click Add.
4
Click  Study.
5
In the Select Study tree, select Preset Studies for Selected Physics Interfaces>Mode Analysis.
6
Global Definitions
Parameters 1
1
In the Model Builder window, under Global Definitions click Parameters 1.
2
In the Settings window for Parameters, locate the Parameters section.
3
Click  Load from File.
4
Geometry 1
1
In the Model Builder window, under Component 1 (comp1) click Geometry 1.
2
In the Settings window for Geometry, locate the Units section.
3
From the Length unit list, choose µm.
Square 1 (sq1)
1
In the Geometry toolbar, click  Square.
2
In the Settings window for Square, locate the Size section.
3
In the Side length text field, type 20[um].
4
Locate the Position section. From the Base list, choose Center.
Rectangle 1 (r1)
1
In the Geometry toolbar, click  Rectangle.
2
In the Settings window for Rectangle, locate the Size and Shape section.
3
In the Width text field, type height.
4
In the Height text field, type height.
5
Locate the Position section. From the Base list, choose Center.
6
Click  Build All Objects.
7
Click the  Zoom Extents button in the Graphics toolbar.
Electromagnetic Waves, Frequency Domain (ewfd)
Wave Equation, Electric 1
1
In the Model Builder window, under Component 1 (comp1)>Electromagnetic Waves, Frequency Domain (ewfd) click Wave Equation, Electric 1.
2
In the Settings window for Wave Equation, Electric, locate the Electric Displacement Field section.
3
From the Electric displacement field model list, choose Relative permittivity.
Materials
Cladding
1
In the Model Builder window, under Component 1 (comp1) right-click Materials and choose Blank Material.
2
In the Settings window for Material, type Cladding in the Label text field.
3
Locate the Material Contents section. In the table, enter the following settings:
Core
1
Right-click Materials and choose Blank Material.
2
In the Settings window for Material, type Core in the Label text field.
3
4
Locate the Material Contents section. In the table, enter the following settings:
Mesh 1
1
In the Model Builder window, under Component 1 (comp1) click Mesh 1.
2
In the Settings window for Mesh, locate the Mesh Settings section.
3
From the Sequence type list, choose User-controlled mesh.
Size
1
In the Model Builder window, under Component 1 (comp1)>Mesh 1 click Size.
2
In the Settings window for Size, locate the Element Size section.
3
Click the Predefined button.
Size 1
1
In the Model Builder window, click Size 1.
2
In the Settings window for Size, locate the Element Size Parameters section.
3
In the Maximum element size text field, type height/15.
4
Click  Build All.
Study - Diagonal Transverse Anisotropy
1
In the Model Builder window, click Study 1.
2
In the Settings window for Study, type Study - Diagonal Transverse Anisotropy in the Label text field.
Parametric Sweep
1
In the Study toolbar, click  Parametric Sweep.
2
In the Settings window for Parametric Sweep, locate the Study Settings section.
3
4
Step 1: Mode Analysis
1
In the Model Builder window, click Step 1: Mode Analysis.
2
In the Settings window for Mode Analysis, locate the Study Settings section.
3
In the Mode analysis frequency text field, type f0.
4
Select the Desired number of modes check box.
5
6
Select the Search for modes around check box.
7
8
In the Study toolbar, click  Compute.
Results
Power and Electric Field - Diagonal Transverse Anisotropy
1
In the Model Builder window, expand the Results>Electric Field (ewfd) node, then click Electric Field (ewfd).
2
In the Settings window for 2D Plot Group, type Power and Electric Field - Diagonal Transverse Anisotropy in the Label text field.
3
Locate the Data section. From the Effective mode index list, choose 1.5036.
Surface 1
1
In the Model Builder window, click Surface 1.
2
In the Settings window for Surface, click Replace Expression in the upper-right corner of the Expression section. From the menu, choose Component 1 (comp1)>Electromagnetic Waves, Frequency Domain>Energy and power>Power flow, time average - W/m²>ewfd.Poavz - Power flow, time average, z component.
Arrow Surface 1
1
In the Model Builder window, right-click Power and Electric Field - Diagonal Transverse Anisotropy and choose Arrow Surface.
2
In the Settings window for Arrow Surface, click Replace Expression in the upper-right corner of the Expression section. From the menu, choose Component 1 (comp1)>Electromagnetic Waves, Frequency Domain>Electric>ewfd.Ex,ewfd.Ey - Electric field.
3
Locate the Arrow Positioning section. Find the X grid points subsection. In the Points text field, type 30.
4
Find the Y grid points subsection. In the Points text field, type 30.
5
Locate the Coloring and Style section. From the Color list, choose Black.
Contour 1
1
Right-click Power and Electric Field - Diagonal Transverse Anisotropy and choose Contour.
2
In the Settings window for Contour, click Replace Expression in the upper-right corner of the Expression section. From the menu, choose ewfd.Poavz - Power flow, time average, z component - W/m².
3
Locate the Coloring and Style section. From the Coloring list, choose Uniform.
4
From the Color list, choose Gray.
5
Clear the Color legend check box.
Power and Electric Field - Diagonal Transverse Anisotropy
1
In the Model Builder window, click Power and Electric Field - Diagonal Transverse Anisotropy.
2
In the Settings window for 2D Plot Group, click to expand the Title section.
3
From the Title type list, choose Manual.
4
Select the Allow evaluation of expressions check box.
5
From the Number format list, choose Automatic.
6
In the Precision text field, type 5.
7
In the Title text area, type Height=eval(height,nm) nm Effective mode index=eval(ewfd.neff) Surface and Countour: Power Arrows: Electric field.
8
Clear the Parameter indicator text field.
9
In the Power and Electric Field - Diagonal Transverse Anisotropy toolbar, click  Plot.
10
Click the  Zoom In button in the Graphics toolbar twice.
Dispersion Curves - Diagonal Transverse Anisotropy
1
In the Home toolbar, click  Add Plot Group and choose 1D Plot Group.
2
In the Settings window for 1D Plot Group, type Dispersion Curves - Diagonal Transverse Anisotropy in the Label text field.
3
Locate the Data section. From the Dataset list, choose Study - Diagonal Transverse Anisotropy/Parametric Solutions 1 (sol2).
4
Locate the Legend section. Clear the Show legends check box.
Global 1
1
Right-click Dispersion Curves - Diagonal Transverse Anisotropy and choose Global.
2
In the Settings window for Global, locate the y-Axis Data section.
3
4
Locate the x-Axis Data section. From the Axis source data list, choose Outer solutions.
5
From the Parameter list, choose Expression.
6
In the Expression text field, type ewfd.k0*height.
7
Click to expand the Coloring and Style section. Find the Line style subsection. From the Line list, choose None.
8
From the Color list, choose Black.
9
Find the Line markers subsection. From the Marker list, choose Point.
10
In the Number text field, type 100.
11
In the Dispersion Curves - Diagonal Transverse Anisotropy toolbar, click  Plot.
Dispersion Curves - Diagonal Transverse Anisotropy
Remove solution 3, which represents the Ey22 mode, as this mode was not included in Ref. 1.
1
In the Model Builder window, click Dispersion Curves - Diagonal Transverse Anisotropy.
2
In the Settings window for 1D Plot Group, locate the Data section.
3
From the Effective mode index selection list, choose Manual.
4
In the Effective mode index indices (1-7) text field, type 1 2 4 5 6 7.
5
Locate the Plot Settings section. Select the x-axis label check box.
6
7
Select the y-axis label check box.
8
In the associated text field, type (Effective index)<sup>2</sub>.
Adjust the axis limits to be the same as in Ref. 1.
9
Locate the Axis section. Select the Manual axis limits check box.
10
In the x minimum text field, type 0.
11
In the x maximum text field, type 15.
12
In the y minimum text field, type 2.05.
13
In the y maximum text field, type 2.31.
Annotation 1
1
Right-click Dispersion Curves - Diagonal Transverse Anisotropy and choose Annotation.
2
In the Settings window for Annotation, locate the Annotation section.
3
In the Text text field, type \[E^{y}_{11}\].
4
Locate the Position section. In the X text field, type 10.
5
In the Y text field, type 2.225.
6
Locate the Coloring and Style section. Select the LaTeX markup check box.
7
Clear the Show point check box.
Annotation 2
1
Right-click Annotation 1 and choose Duplicate.
2
In the Settings window for Annotation, locate the Annotation section.
3
In the Text text field, type \[E^{x}_{11}\].
4
Locate the Position section. In the Y text field, type 2.125.
Annotation 3
1
Right-click Annotation 2 and choose Duplicate.
2
In the Settings window for Annotation, locate the Annotation section.
3
In the Text text field, type \[E^{y}_{21}\].
4
Locate the Position section. In the X text field, type 13.
5
In the Y text field, type 2.165.
Annotation 4
1
Right-click Annotation 3 and choose Duplicate.
2
In the Settings window for Annotation, locate the Annotation section.
3
In the Text text field, type \[E^{y}_{12}\].
4
Locate the Position section. In the X text field, type 13.5.
5
In the Y text field, type 2.15.
Annotation 5
1
Right-click Annotation 4 and choose Duplicate.
2
In the Settings window for Annotation, locate the Annotation section.
3
In the Text text field, type \[E^{x}_{21}\].
4
Locate the Position section. In the X text field, type 14.
5
In the Y text field, type 2.09.
Annotation 6
1
Right-click Annotation 5 and choose Duplicate.
2
In the Settings window for Annotation, locate the Annotation section.
3
In the Text text field, type \[E^{x}_{12}\].
4
Locate the Position section. In the Y text field, type 2.07.
Dispersion Curves - Diagonal Transverse Anisotropy
1
In the Model Builder window, click Dispersion Curves - Diagonal Transverse Anisotropy.
2
In the Settings window for 1D Plot Group, click to expand the Title section.
3
From the Title type list, choose None.
Electromagnetic Waves, Frequency Domain (ewfd)
Now, redo the simulation for off-diagonal longitudinal anisotropy. That is, in this case the optical axis is directed at 45-degree angle from the y-axis in the yz-plane.
Wave Equation, Off-Diagonal Longitudinal Anisotropy
1
In the Physics toolbar, click  Domains and choose Wave Equation, Electric.
2
In the Settings window for Wave Equation, Electric, type Wave Equation, Off-Diagonal Longitudinal Anisotropy in the Label text field.
3
4
Locate the Electric Displacement Field section. From the Electric displacement field model list, choose Relative permittivity.
5
From the εr list, choose User defined. From the list, choose Symmetric.
6
In the εr table, enter the following settings:
Add Study
1
In the Home toolbar, click  Add Study to open the Add Study window.
2
Go to the Add Study window.
3
Find the Studies subsection. In the Select Study tree, select Preset Studies for Selected Physics Interfaces>Mode Analysis.
4
Click Add Study in the window toolbar.
Study - Off-Diagonal Longitudinal Anisotropy
1
In the Model Builder window, click Study 2.
2
In the Settings window for Study, type Study - Off-Diagonal Longitudinal Anisotropy in the Label text field.
Study - Diagonal Transverse Anisotropy
Parametric Sweep
In the Model Builder window, under Study - Diagonal Transverse Anisotropy right-click Parametric Sweep and choose Copy.
Study - Off-Diagonal Longitudinal Anisotropy
In the Model Builder window, right-click Study - Off-Diagonal Longitudinal Anisotropy and choose Paste Parametric Sweep.
Step 1: Mode Analysis
1
In the Settings window for Mode Analysis, locate the Study Settings section.
2
In the Mode analysis frequency text field, type f0.
3
Select the Search for modes around check box.
4
5
In the Home toolbar, click  Add Study to close the Add Study window.
6
In the Home toolbar, click  Compute.
Results
Power and Electric Field - Off-Diagonal Longitudinal Anisotropy
1
In the Settings window for 2D Plot Group, type Power and Electric Field - Off-Diagonal Longitudinal Anisotropy in the Label text field.
2
Locate the Data section. From the Effective mode index list, choose 1.5035.
Arrow Surface 1, Contour 1
1
In the Model Builder window, under Results>Power and Electric Field - Diagonal Transverse Anisotropy, Ctrl-click to select Arrow Surface 1 and Contour 1.
2
Arrow Surface 1
In the Model Builder window, right-click Power and Electric Field - Off-Diagonal Longitudinal Anisotropy and choose Paste Multiple Items.
Surface 1
In the Settings window for Surface, click Replace Expression in the upper-right corner of the Expression section. From the menu, choose ewfd.Poavz - Power flow, time average, z component - W/m².
Power and Electric Field - Off-Diagonal Longitudinal Anisotropy
1
In the Model Builder window, click Power and Electric Field - Off-Diagonal Longitudinal Anisotropy.
2
In the Settings window for 2D Plot Group, locate the Title section.
3
From the Title type list, choose Manual.
4
Select the Allow evaluation of expressions check box.
5
From the Number format list, choose Automatic.
6
In the Precision text field, type 5.
7
In the Title text area, type Height=eval(height,nm) nm Effective mode index=eval(ewfd.neff) Surface and Countour: Power Arrows: Electric field.
8
Clear the Parameter indicator text field.
Dispersion Curves - Off-Diagonal Longitudinal Anisotropy
1
In the Model Builder window, right-click Dispersion Curves - Diagonal Transverse Anisotropy and choose Duplicate.
2
In the Settings window for 1D Plot Group, type Dispersion Curves - Off-Diagonal Longitudinal Anisotropy in the Label text field.
3
Locate the Data section. From the Dataset list, choose Study - Off-Diagonal Longitudinal Anisotropy/Parametric Solutions 2 (sol19).
4
From the Effective mode index selection list, choose All.
Annotation 1
1
In the Model Builder window, expand the Dispersion Curves - Off-Diagonal Longitudinal Anisotropy node, then click Annotation 1.
2
In the Settings window for Annotation, locate the Annotation section.
3
In the Text text field, type \[E^{x}_{11}\].
Annotation 2
1
In the Model Builder window, click Annotation 2.
2
In the Settings window for Annotation, locate the Annotation section.
3
In the Text text field, type \[E^{y}_{11}\].
4
Locate the Position section. In the Y text field, type 2.175.
Annotation 3
1
In the Model Builder window, click Annotation 3.
2
In the Settings window for Annotation, locate the Annotation section.
3
In the Text text field, type \[E^{x}_{12}\].
4
Locate the Position section. In the X text field, type 12.
5
In the Y text field, type 2.145.
Annotation 4
1
In the Model Builder window, click Annotation 4.
2
In the Settings window for Annotation, locate the Annotation section.
3
In the Text text field, type \[E^{x}_{21}\].
4
Locate the Position section. In the X text field, type 12.5.
5
In the Y text field, type 2.13.
Annotation 5
1
In the Model Builder window, click Annotation 5.
2
In the Settings window for Annotation, locate the Annotation section.
3
In the Text text field, type \[E^{y}_{21}\].
4
Locate the Position section. In the X text field, type 12.5.
5
In the Y text field, type 2.111.
Annotation 6
1
In the Model Builder window, click Annotation 6.
2
In the Settings window for Annotation, locate the Annotation section.
3
In the Text text field, type \[E^{y}_{12}\].
4
Locate the Position section. In the X text field, type 13.
5
In the Y text field, type 2.095.
6
In the Dispersion Curves - Off-Diagonal Longitudinal Anisotropy toolbar, click  Plot.