PDF

Ball Check Valve
Introduction
A ball check valve is a special type of valve in which a unidirectional fluid flow is ensured. In this valve, a movable spring-loaded ball controls the flow. When no inlet pressure is applied, the ball is forced into contact with an O-ring through the preload in the spring. For an inlet pressure imposing a flow in the operating direction, the slit between the ball and the O-ring opens when the fluid force acting on the ball becomes larger than the spring force. In the case of a flow in the opposite direction, the slit between the ball and the O-ring remains closed and the fluid is thus prevented from passing through the valve.
Figure 1 illustrates the fluid flow around the ball at the maximum opening position.
Figure 1: 3D view of the velocity field within the valve at the maximum opening position. The flow is directed upward in the figure.
In this example, you will learn how to solve a structural contact problem where a fluid is surrounding and acting on the potentially contacting solid parts.
Model Definition
The valve is 3.6 cm long with an outer diameter of 1 cm. The ball chamber inner diameter is 8.4 mm, and the ball diameter is 7.2 mm. The tube inner diameter is 5 mm. The ball chamber length is 1 cm.
The model geometry is reduced to a 2D axisymmetric cut as shown in Figure 2.
Figure 2: Geometry and materials.
Material Properties
The ball and the valve body are made of steel, the O-ring is made of nylon. The material properties are given in Table 1.
The fluid used in this study is water at room temperature.
Boundary Conditions
Solid Mechanics
The ball is free to move along the symmetry axis and is subjected to both a spring load and to the fluid forces. The fluid forces are automatically applied when using the Fluid-Structure Interaction multiphysics coupling. The nylon O-ring is attached to the valve body which is assumed to be rigid. The rigidity is enforced by applying a Fixed Constraint to the entire valve body.
Structural contact between the ball and the O-ring is modeled.
The spring that holds the ball against the O-ring is not represented in the geometry, instead a spring foundation is used. The spring constant is 2 N/m, and the spring is under 5 mm predeformation when the ball is at rest in the valve. To ensure consistent initial conditions, the spring predeformation is ramped up using a smooth step function.
Laminar Flow
To study the functioning of the valve, first a reversed flow and then an operating flow are applied. Both upstream (bottom) and downstream (top) boundaries are defined as inlet conditions with a varying pressure. The maximum pressure is 25 mbar.
Moving Mesh
The mesh surrounding the ball is set to deform freely, following a Yeoh mesh smoothing deformation. The mesh displacement is controlled by the structural displacement at the boundaries. At the remaining boundaries, adjacent to the fluid, a fixed boundary is used.
Results and Discussion
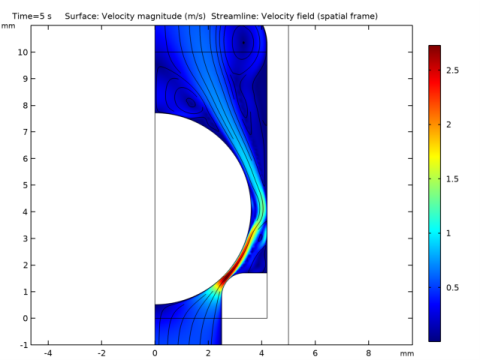
Figure 3 shows the fluid velocity at the maximum opening of the valve. The maximum velocity is about 2.5 m/s and the main flow path and the recirculation flow around it are clearly visible.
Figure 3: Fluid velocity at the maximum opening of the valve.
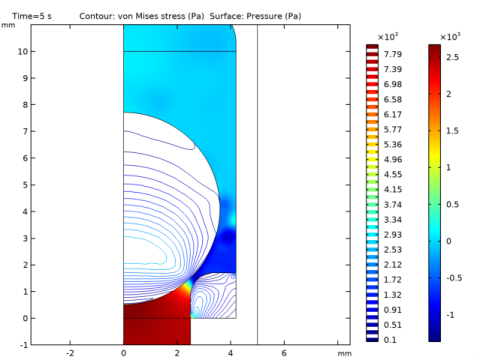
Figure 4 shows the pressure distribution in the fluid and the von Mises stress in the solid at maximum opening of the valve.
Figure 4: Fluid pressure and von Mises stress at maximum opening of the valve.
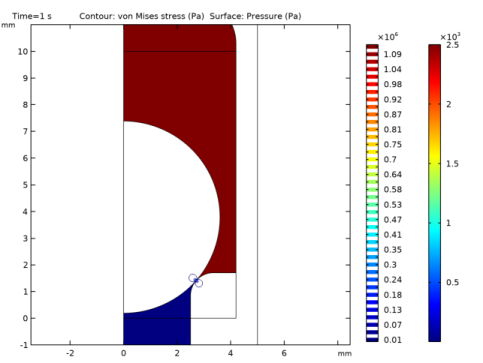
Figure 5 and Figure 6 show the fluid pressure when the valve is closed and under maximum pressure in the reverse direction.
Figure 5: Fluid pressure and von Mises stress at maximum reversed pressure.
Figure 6: Fluid pressure and von Mises stress at maximum reverse pressure (close-up view of the contact region).
The fluid pressure drop when the flow is blocked in the contact region is clearly visible. The contact is almost localized as a single point contact.
Figure 7 shows the ball displacement as a function of time.
Figure 7: Ball center displacement versus time. The inlet pressures are shown for reference.
The ball moves down slightly as the spring predeformation is applied. As the reverse pressure increases, the displacement of the ball is negligible. After 2 s, the flow in the operating direction is increased until the ball reaches a maximum displacement of about 0.38 mm.
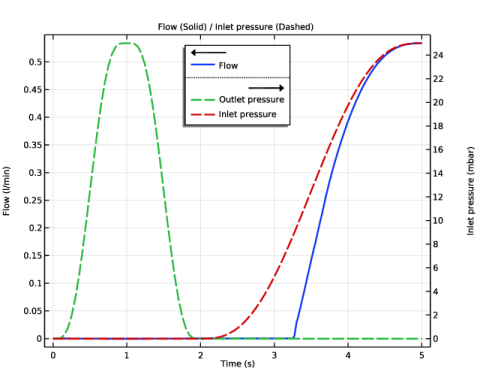
Figure 8 shows the flow in the valve as a function of time.
Figure 8: Fluid flow in the valve versus time.
Up to 1 s, the pressure is imposed in the reversed flow direction. The maximum reverse flow is about 0.3 ml/min. This small value is explained by the clearance between the parts in contact which is necessary to avoid topology changes in the fluid domain (see the section Notes About the COMSOL Implementation for more details). The reversed flow can be decreased even more by reducing the contact offset value, at the price of extra solution time caused by mesh refinement.
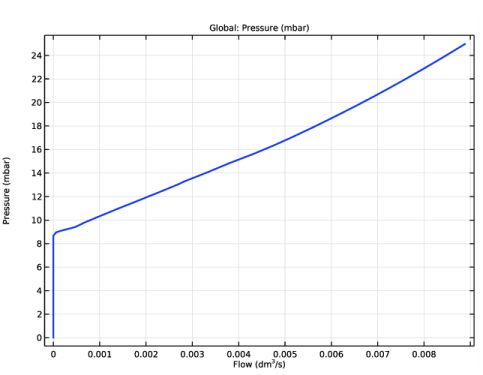
Figure 9 shows the operating curve of the valve.
Figure 9: Operating curve of the valve.
From this plot, the opening pressure is seen to be about 4.5 mbar.
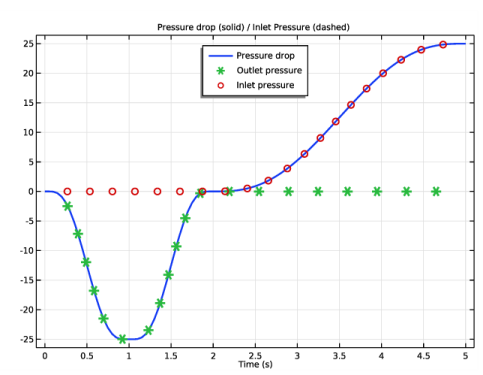
Figure 10 shows the fluid pressure drop in the valve together with the inlet pressure conditions applied during the analysis.
Figure 10: Pressure drop in the valve and inlet pressure condition at top boundary/downstream (dashed green) and bottom/upstream boundary (dashed red).
In the case of reversed flow conditions, the pressure drop corresponds exactly to the inlet condition 1, since there is no flow in the valve. In the case of an opening flow condition, the pressure drop is lower than the inlet pressure condition 2, as the fluid passes through the valve.
Notes About the COMSOL Implementation
The main purpose of this model is to show how to solve a fluid structure interaction where two elastic parts separated by a fluid can get in contact with each other. The Arbitrary Lagrangian Eulerian (ALE) formulation used for the discretization of the Navier-Stokes equations in a deforming domain requires that the topology of this domain does not change. In a real contact situation, the topology of the fluid domain changes as the parts get into contact. For a numerical analysis, you need to include an offset in the contact settings to prevent the parts to get into physical contact. In this model, the offset is set to a very small value (5 μm) which is sufficient to preserve the fluid-domain topology while still preventing any significant flow in the reverse direction when the valve is closed.
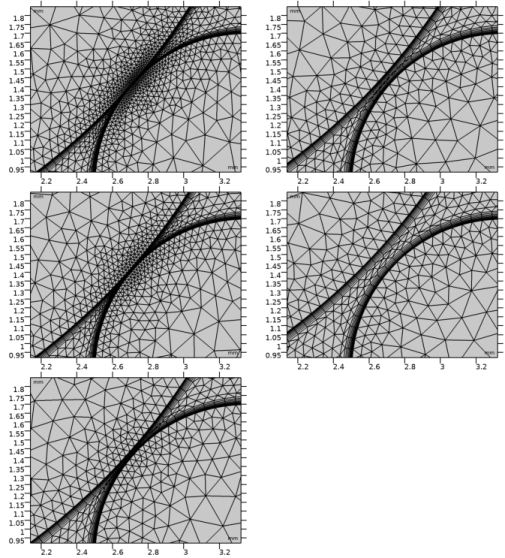
To obtain a good accuracy of the solution, automatic remeshing is used when the ball is getting into contact with the O-ring or is moving away. Because of boundary layer mesh, it is recommended to use distortion as condition for remeshing, here the geometry is remeshed when the square root of the maximum element distortion exceeds 1.Figure 11 shows the different meshes used in the computation.
Figure 11: Mesh cases used during the computation (from top to bottom, left to right).
In order to ensure proper restart after the automatic remeshing, it is important to well refine the mesh at the fluid-structure interface. Moreover in the solver settings you can enforce consistent initialization.
The Fluid-Solid Interaction multiphysics interface adds a Deforming Domain node where you define the fluid domains to be controlled by structural deformation at their boundaries. In this model, the displacement of the ball is confined, and it is a good idea to split the fluid region into three domains. The central fluid domain (the one containing the moving ball) uses a freely moving deformed mesh, while the bottom and top fluid domains use a fixed mesh. This way you restrict the computation of the moving mesh equations to a minimum.
In this particular example, the valve body is actually modeled as rigid, so except for the contact region it could have been removed from the model entirely. Keeping it will, however, allow better visualization of the model and results.
In the Fluid-Structure Interaction multiphysics coupling, all boundaries between fluid and solid are selected as a default. You could choose to remove the boundaries adjacent to the rigid domains. Here the coupling type has instead been changed to Fluid loading on structure to avoid adding the extra degrees of freedoms that would be added for a bidirectional coupling in a fixed geometry case.
Application Library path: Structural_Mechanics_Module/Fluid-Structure_Interaction/ball_check_valve
Modeling Instructions
From the File menu, choose New.
New
In the New window, click  Model Wizard.
Model Wizard
1
In the Model Wizard window, click  2D Axisymmetric.
2
In the Select Physics tree, select Fluid Flow>Single-Phase Flow>Turbulent Flow>Turbulent Flow, Algebraic yPlus (spf).
3
Click Add.
4
In the Velocity field text field, type u_fluid.
5
In the Velocity field components table, enter the following settings:
6
In the Select Physics tree, select Fluid Flow>Fluid-Structure Interaction>Fluid-Solid Interaction.
7
Click Add.
8
In the Added physics interfaces tree, select Laminar Flow (spf2).
9
Click  Remove.
10
Click  Study.
11
In the Select Study tree, select Preset Studies for Selected Physics Interfaces>Turbulent Flow, Algebraic yPlus>Time Dependent with Initialization.
12
Global Definitions
Parameters 1
1
In the Model Builder window, under Global Definitions click Parameters 1.
2
In the Settings window for Parameters, locate the Parameters section.
3
Geometry 1
1
In the Model Builder window, under Component 1 (comp1) click Geometry 1.
2
In the Settings window for Geometry, locate the Units section.
3
From the Length unit list, choose mm.
Rectangle 1 (r1)
1
In the Geometry toolbar, click  Rectangle.
2
In the Settings window for Rectangle, locate the Size and Shape section.
3
In the Width text field, type r4-r1.
4
In the Height text field, type l.
5
Locate the Position section. In the r text field, type r1.
6
In the z text field, type -l.
Rectangle 2 (r2)
1
In the Geometry toolbar, click  Rectangle.
2
In the Settings window for Rectangle, locate the Size and Shape section.
3
In the Width text field, type r4-r2.
4
In the Height text field, type l.
5
Locate the Position section. In the r text field, type r2.
Rectangle 3 (r3)
1
In the Geometry toolbar, click  Rectangle.
2
In the Settings window for Rectangle, locate the Size and Shape section.
3
In the Width text field, type r4-r1.
4
In the Height text field, type 3/2*l.
5
Locate the Position section. In the r text field, type r1.
6
In the z text field, type l.
Union 1 (uni1)
1
In the Geometry toolbar, click  Booleans and Partitions and choose Union.
2
Click in the Graphics window and then press Ctrl+A to select all objects.
3
In the Settings window for Union, locate the Union section.
4
Clear the Keep interior boundaries check box.
Fillet 1 (fil1)
1
In the Geometry toolbar, click  Fillet.
2
On the object uni1, select Point 6 only.
3
In the Settings window for Fillet, locate the Radius section.
4
In the Radius text field, type r2-r1.
Fillet 2 (fil2)
1
In the Geometry toolbar, click  Fillet.
2
On the object fil1, select Point 3 only.
3
In the Settings window for Fillet, locate the Radius section.
4
In the Radius text field, type r2-r1.
Square 1 (sq1)
1
In the Geometry toolbar, click  Square.
2
In the Settings window for Square, locate the Size section.
3
In the Side length text field, type r2-r1.
4
Locate the Position section. In the r text field, type r1.
Fillet 3 (fil3)
1
In the Geometry toolbar, click  Fillet.
2
On the object sq1, select Point 4 only.
3
In the Settings window for Fillet, locate the Radius section.
4
In the Radius text field, type (r2-r1)/2.
Rectangle 4 (r4)
1
In the Geometry toolbar, click  Rectangle.
2
In the Settings window for Rectangle, locate the Size and Shape section.
3
In the Width text field, type r4.
4
In the Height text field, type 7/2*l.
5
Locate the Position section. In the z text field, type -l.
Circle 1 (c1)
1
In the Geometry toolbar, click  Circle.
2
In the Settings window for Circle, locate the Size and Shape section.
3
In the Radius text field, type r3.
4
In the Sector angle text field, type 180.
5
Locate the Position section. In the z text field, type r3.
6
Locate the Rotation Angle section. In the Rotation text field, type -90.
You will now create imprints at the expected contact location.
Partition Domains 1 (pard1)
1
In the Geometry toolbar, click  Booleans and Partitions and choose Partition Domains.
2
On the object c1, select Domain 1 only.
3
On the object fil3, select Domain 1 only.
4
In the Settings window for Partition Domains, locate the Partition Domains section.
5
Find the Vertices defining line segments subsection. Select the  Activate Selection toggle button.
6
From the Partition with list, choose Edges.
7
On the object c1, select Boundary 1 only.
8
On the object fil3, select Boundary 5 only.
Move 1 (mov1)
1
In the Geometry toolbar, click  Transforms and choose Move.
2
Select the object pard1(1) only.
3
In the Settings window for Move, locate the Displacement section.
4
In the z text field, type 0.19 to ensure a clearance slightly above the contact offset.
Union 2 (uni2)
1
In the Geometry toolbar, click  Booleans and Partitions and choose Union.
2
Select the objects mov1 and pard1(2) only.
3
In the Settings window for Union, locate the Union section.
4
Clear the Keep interior boundaries check box.
Rectangle 5 (r5)
1
In the Geometry toolbar, click  Rectangle.
2
In the Settings window for Rectangle, locate the Size and Shape section.
3
In the Width text field, type r2.
4
In the Height text field, type 10.
With this fourth rectangle object, you will be able to define where to apply a moving mesh domain.
Form Union (fin)
1
In the Model Builder window, click Form Union (fin).
2
In the Settings window for Form Union/Assembly, click  Build Selected.
3
Click the  Zoom Extents button in the Graphics toolbar.
Add Material
1
In the Home toolbar, click  Add Material to open the Add Material window.
2
Go to the Add Material window.
3
In the tree, select Built-in>Water, liquid.
4
Click  Add to Component 1 (comp1).
5
In the tree, select Built-in>Nylon.
6
Click  Add to Component 1 (comp1).
7
In the tree, select Built-in>Structural steel.
8
Click  Add to Component 1 (comp1).
9
In the Home toolbar, click  Add Material to close the Add Material window.
Materials
Water, liquid (mat1)
In the Settings window for Material, click to expand the Appearance section.
Nylon (mat2)
1
In the Model Builder window, click Nylon (mat2).
2
3
In the Settings window for Material, click to expand the Appearance section.
4
From the Material type list, choose Plastic.
Structural steel (mat3)
1
In the Model Builder window, click Structural steel (mat3).
2
3
In the Settings window for Material, click to expand the Appearance section.
4
From the Material type list, choose Steel.
5
Click the Show Material Color and Texture button in the Graphics toolbar.
Definitions
Deforming Domain 1
1
In the Model Builder window, under Component 1 (comp1)>Definitions>Moving Mesh click Deforming Domain 1.
2
Prescribed Normal Mesh Displacement 1
1
In the Definitions toolbar, click  Moving Mesh and choose Prescribed Normal Mesh Displacement.
2
Piecewise 1 (pw1)
1
In the Definitions toolbar, click  Piecewise.
2
In the Settings window for Piecewise, type p_outlet in the Function name text field.
3
Locate the Definition section. From the Smoothing list, choose Continuous second derivative.
4
From the Transition zone list, choose Absolute size.
5
In the Size of transition zone text field, type 0.45.
6
Find the Intervals subsection. In the table, enter the following settings:
7
Locate the Units section. In the Arguments text field, type s.
8
In the Function text field, type Pa.
Piecewise 2 (pw2)
1
In the Definitions toolbar, click  Piecewise.
2
In the Settings window for Piecewise, type p_inlet in the Function name text field.
3
Locate the Definition section. From the Smoothing list, choose Continuous second derivative.
4
From the Transition zone list, choose Absolute size.
5
In the Size of transition zone text field, type 1.5.
6
Find the Intervals subsection. In the table, enter the following settings:
7
Locate the Units section. In the Arguments text field, type s.
8
In the Function text field, type Pa.
Step 1 (step1)
1
In the Definitions toolbar, click  More Functions and choose Step.
2
In the Settings window for Step, type predef in the Function name text field.
3
Locate the Parameters section. In the Location text field, type 0.5.
4
In the To text field, type -l0.
5
Click to expand the Smoothing section. In the Size of transition zone text field, type 1.
Integration 1 (intop1)
1
In the Definitions toolbar, click  Nonlocal Couplings and choose Integration.
2
In the Settings window for Integration, locate the Source Selection section.
3
From the Geometric entity level list, choose Boundary.
4
Integration 2 (intop2)
1
In the Definitions toolbar, click  Nonlocal Couplings and choose Integration.
2
In the Settings window for Integration, locate the Source Selection section.
3
From the Geometric entity level list, choose Point.
4
5
Locate the Advanced section. Clear the Compute integral in revolved geometry check box.
Variables 1
1
In the Model Builder window, right-click Definitions and choose Variables.
2
In the Settings window for Variables, locate the Variables section.
3
Turbulent Flow, Algebraic yPlus (spf)
1
In the Model Builder window, under Component 1 (comp1) click Turbulent Flow, Algebraic yPlus (spf).
2
3
In the Settings window for Turbulent Flow, Algebraic yPlus, locate the Turbulence section.
4
From the Wall treatment list, choose Low Re.
Inlet 1
1
In the Physics toolbar, click  Boundaries and choose Inlet.
2
3
In the Settings window for Inlet, locate the Boundary Condition section.
4
5
Locate the Pressure Conditions section. In the p0 text field, type p_inlet(t).
6
Clear the Suppress backflow check box.
Outlet 1
1
In the Physics toolbar, click  Boundaries and choose Outlet.
2
3
In the Settings window for Outlet, locate the Pressure Conditions section.
4
In the p0 text field, type p_outlet(t).
5
Clear the Suppress backflow check box.
Solid Mechanics (solid)
1
In the Model Builder window, under Component 1 (comp1) click Solid Mechanics (solid).
2
Fixed Constraint 1
1
In the Physics toolbar, click  Domains and choose Fixed Constraint.
2
Spring Foundation 1
1
In the Physics toolbar, click  Domains and choose Spring Foundation.
2
3
In the Settings window for Spring Foundation, locate the Spring section.
4
From the Spring type list, choose Total spring constant.
5
6
In the ktot table, enter the following settings:
Predeformation 1
1
In the Physics toolbar, click  Attributes and choose Predeformation.
2
In the Settings window for Predeformation, locate the Spring Predeformation section.
3
Specify the u0 vector as
You will now set up the contact condition between the ball and the O-ring.
Definitions
Contact Pair 1 (p1)
1
In the Definitions toolbar, click  Pairs and choose Contact Pair.
2
3
In the Settings window for Pair, locate the Destination Boundaries section.
4
Select the  Activate Selection toggle button.
5
Solid Mechanics (solid)
Contact 1
1
In the Physics toolbar, click  Pairs and choose Contact.
2
In the Settings window for Contact, locate the Pair Selection section.
3
Under Pairs, click  Add.
4
In the Add dialog box, select Contact Pair 1 (p1) in the Pairs list.
5
6
In the Settings window for Contact, click to expand the Contact Surface Offset and Adjustment section.
7
In the doffset,d text field, type offset to prevent the part from getting physically in contact. This way, the topology of the moving mesh domain is kept.
Multiphysics
Fluid-Structure Interaction 1 (fsi1)
1
In the Model Builder window, under Component 1 (comp1)>Multiphysics click Fluid-Structure Interaction 1 (fsi1).
2
In the Settings window for Fluid-Structure Interaction, locate the Fixed Geometry section.
3
From the Fixed geometry coupling type list, choose Fluid loading on structure.
Mesh 1
1
In the Model Builder window, under Component 1 (comp1) click Mesh 1.
2
In the Settings window for Mesh, locate the Physics-Controlled Mesh section.
3
From the Element size list, choose Fine.
4
Click  Build All.
Study 1
Step 2: Time Dependent
1
In the Model Builder window, under Study 1 click Step 2: Time Dependent.
2
In the Settings window for Time Dependent, locate the Study Settings section.
3
In the Output times text field, type range(0,5e-2,5).
4
Click to expand the Results While Solving section. Select the Plot check box.
5
From the Update at list, choose Time steps taken by solver.
Solution 1 (sol1)
1
In the Study toolbar, click  Show Default Solver.
2
In the Model Builder window, expand the Solution 1 (sol1) node.
3
In the Model Builder window, expand the Study 1>Solver Configurations>Solution 1 (sol1)>Dependent Variables 2 node, then click Pressure (comp1.p).
4
In the Settings window for Field, locate the Scaling section.
5
From the Method list, choose Manual.
6
In the Scale text field, type 1e3.
7
In the Model Builder window, click Spatial mesh displacement (comp1.spatial.disp).
8
In the Settings window for Field, locate the Scaling section.
9
In the Scale text field, type 1e-5.
10
In the Model Builder window, click Velocity field (spatial frame) (comp1.u_fluid).
11
In the Settings window for Field, locate the Scaling section.
12
From the Method list, choose Manual.
13
In the Scale text field, type 1.
14
In the Model Builder window, click Displacement field (comp1.u_solid).
15
In the Settings window for Field, locate the Scaling section.
16
In the Scale text field, type 1e-5.
17
In the Model Builder window, click Time-Dependent Solver 1.
18
In the Settings window for Time-Dependent Solver, click to expand the Time Stepping section.
19
From the Steps taken by solver list, choose Intermediate.
20
Right-click Time-Dependent Solver 1 and choose Automatic Remeshing.
21
In the Settings window for Automatic Remeshing, locate the Condition for Remeshing section.
22
From the Condition type list, choose Distortion.
23
In the Stop when distortion exceeds text field, type 1.
24
Locate the Remesh section. From the Consistent initialization list, choose Backward Euler.
25
Click  Compute.
Results
Velocity (spf)
The default plot shows the fluid velocity inside the valve at maximum opening.
Streamline 1
1
In the Model Builder window, right-click Velocity (spf) and choose Streamline.
2
In the Settings window for Streamline, locate the Streamline Positioning section.
3
From the Positioning list, choose Uniform density.
4
In the Separating distance text field, type 0.01.
5
In the Velocity (spf) toolbar, click  Plot.
Contour
1
In the Model Builder window, expand the Results>Pressure (spf) node, then click Contour.
2
In the Settings window for Contour, locate the Expression section.
3
In the Expression text field, type solid.mises.
Surface 1
1
In the Model Builder window, right-click Pressure (spf) and choose Surface.
2
In the Settings window for Surface, locate the Expression section.
3
In the Expression text field, type p.
4
In the Pressure (spf) toolbar, click  Plot.
Flow
1
In the Home toolbar, click  Add Plot Group and choose 1D Plot Group.
2
In the Settings window for 1D Plot Group, type Flow in the Label text field.
3
Locate the Data section. From the Dataset list, choose Study 1/Remeshed Solution 1 (sol3).
4
Locate the Legend section. Clear the Show legends check box.
Global 1
1
Right-click Flow and choose Global.
2
In the Settings window for Global, locate the y-Axis Data section.
3
4
Click to expand the Title section. From the Title type list, choose Manual.
5
In the Title text area, type Flow (Solid).
6
Click to expand the Coloring and Style section. In the Width text field, type 2.
Global 2
1
In the Model Builder window, right-click Flow and choose Global.
2
In the Settings window for Global, locate the y-Axis Data section.
3
4
Locate the Coloring and Style section. Find the Line style subsection. From the Line list, choose Dashed.
5
In the Width text field, type 2.
Global 3
1
Right-click Flow and choose Global.
2
In the Settings window for Global, locate the y-Axis Data section.
3
4
Locate the Coloring and Style section. Find the Line style subsection. From the Line list, choose Dashed.
5
In the Width text field, type 2.
6
Locate the Title section. From the Title type list, choose None.
Flow
1
In the Model Builder window, click Flow.
2
In the Settings window for 1D Plot Group, click to expand the Title section.
3
From the Title type list, choose Manual.
4
In the Title text area, type Flow (Solid) / Inlet pressure (Dashed).
5
Locate the Plot Settings section. Select the Two y-axes check box.
6
In the table, select the Plot on secondary y-axis check boxes for Global 2 and Global 3.
7
Select the Secondary y-axis label check box.
8
9
Locate the Legend section. Select the Show legends check box.
10
From the Position list, choose Upper middle.
11
In the Flow toolbar, click  Plot.
Ball Displacement
1
In the Home toolbar, click  Add Plot Group and choose 1D Plot Group.
2
In the Settings window for 1D Plot Group, type Ball Displacement in the Label text field.
3
Locate the Data section. From the Dataset list, choose Study 1/Remeshed Solution 1 (sol3).
Point Graph 1
1
Right-click Ball Displacement and choose Point Graph.
2
3
In the Settings window for Point Graph, locate the y-Axis Data section.
4
In the Expression text field, type w_solid.
5
Select the Description check box.
6
7
Click to expand the Coloring and Style section. In the Width text field, type 2.
8
Click to expand the Legends section. Select the Show legends check box.
9
From the Legends list, choose Manual.
10
Global 2, Global 3
1
In the Model Builder window, under Results>Flow, Ctrl-click to select Global 2 and Global 3.
2
Global 2
In the Model Builder window, right-click Ball Displacement and choose Paste Multiple Items.
Ball Displacement
1
In the Settings window for 1D Plot Group, locate the Title section.
2
From the Title type list, choose Manual.
3
In the Title text area, type Ball displacement (Solid) / Inlet pressure (Dashed).
4
Locate the Plot Settings section. Select the Two y-axes check box.
5
Select the Secondary y-axis label check box.
6
7
In the table, select the Plot on secondary y-axis check boxes for Global 2 and Global 3.
8
Locate the Legend section. From the Position list, choose Upper middle.
9
In the Ball Displacement toolbar, click  Plot.
Operating curve
1
In the Home toolbar, click  Add Plot Group and choose 1D Plot Group.
2
In the Settings window for 1D Plot Group, type Operating curve in the Label text field.
3
Locate the Data section. From the Dataset list, choose Study 1/Remeshed Solution 1 (sol3).
4
Locate the Legend section. Clear the Show legends check box.
Global 1
1
Right-click Operating curve and choose Global.
2
In the Settings window for Global, locate the y-Axis Data section.
3
4
Locate the x-Axis Data section. From the Parameter list, choose Expression.
5
In the Expression text field, type flow.
6
From the Unit list, choose dm^3/s.
7
Locate the Coloring and Style section. In the Width text field, type 2.
8
In the Operating curve toolbar, click  Plot.
Pressure drop
1
In the Home toolbar, click  Add Plot Group and choose 1D Plot Group.
2
In the Settings window for 1D Plot Group, type Pressure drop in the Label text field.
3
Locate the Data section. From the Dataset list, choose Study 1/Remeshed Solution 1 (sol3).
4
Locate the Title section. From the Title type list, choose Manual.
5
In the Title text area, type Pressure drop (solid) / Inlet Pressure (dashed).
6
Locate the Legend section. From the Position list, choose Upper middle.
Point Graph 1
1
Right-click Pressure drop and choose Point Graph.
2
3
In the Settings window for Point Graph, locate the y-Axis Data section.
4
In the Expression text field, type p-intop2(p).
5
From the Unit list, choose mbar.
6
Select the Description check box.
7
8
Locate the Coloring and Style section. In the Width text field, type 2.
9
Locate the Legends section. Select the Show legends check box.
10
From the Legends list, choose Manual.
11
Global 2, Global 3
1
In the Model Builder window, under Results>Flow, Ctrl-click to select Global 2 and Global 3.
2
Global 2
1
In the Model Builder window, right-click Pressure drop and choose Paste Multiple Items.
2
In the Settings window for Global, locate the y-Axis Data section.
3
4
Locate the Coloring and Style section. Find the Line style subsection. From the Line list, choose None.
5
Find the Line markers subsection. From the Marker list, choose Cycle.
6
In the Number text field, type 20.
Global 3
1
In the Model Builder window, click Global 3.
2
In the Settings window for Global, locate the Coloring and Style section.
3
Find the Line style subsection. From the Line list, choose None.
4
Find the Line markers subsection. From the Marker list, choose Cycle.
5
In the Number text field, type 20.
6
In the Pressure drop toolbar, click  Plot.
In the following steps you will generate the plot shown in Figure 1.
Surface
1
In the Model Builder window, expand the Velocity, 3D (spf) node, then click Surface.
2
In the Settings window for Surface, locate the Expression section.
3
In the Expression text field, type solid.disp.
4
Locate the Coloring and Style section. From the Coloring list, choose Uniform.
5
From the Color list, choose Gray.
6
Click to expand the Title section. From the Title type list, choose None.
Streamline 1
1
In the Model Builder window, right-click Velocity, 3D (spf) and choose Streamline.
2
In the Settings window for Streamline, locate the Streamline Positioning section.
3
From the Positioning list, choose Uniform density.
4
In the Separating distance text field, type 0.02.
5
Locate the Coloring and Style section. Find the Point style subsection. From the Type list, choose Arrow.
Color Expression 1
Right-click Streamline 1 and choose Color Expression.
Velocity, 3D (spf)
In the Velocity, 3D (spf) toolbar, click  Plot.