PDF

Radar Cross Section
Introduction
This tutorial model demonstrates the use of a background field in an electromagnetic scattering problem. Although this example is a boat hit by a radar, this same technique can be used in any situation where an isolated object meets electromagnetic waves from a distant source. For example, several orders of magnitude smaller, an equally common application is plasmon resonant nanoparticles. Besides setting up the background field and sweeping it over a range of angles of incidence, this example also shows you how to compute the far-field and the radar cross section (RCS).
Model Definition
This example computes the interaction between a boat and the incident field from a radar transmitter. The transmitter is considered to be distant enough that this field can be treated as a plane wave. This makes it possible to exclude the transmitter from the model geometry and look only at the boat and its immediate surroundings.
Although the modeling procedure is similar in 3D, this example is in 2D to quickly set up and solve. In order to focus on the concepts, the geometry is intentionally kept very simple (see Figure 1).
Figure 1: The model geometry. The boat has a length of 14 m and is surrounded by air - the cut plane lies above the water surface.
The inner circle in the geometry represents air surrounding the boat. The outer circle is a perfectly matched layer (PML), which minimizes unphysical reflections of the scattered wave as it leaves the model domain. The radius of the inner circle is an important model consideration. To get good results, the inner circle needs to completely surround the boat. It also must extend to a considerable fraction of the wavelength, as well as the characteristic length of the evanescent wave outside it. However, in practice, and in order to minimize time and memory usage, do not make the circle too large. For the purpose of this example, the inner circle is bigger than necessary to provide a good view of the near field. The radius of the outer circle does not matter as long as it allows for the meshing needs of the PML, which is 5–6 mesh elements across.
The background electromagnetic field from the radar is described by its out-of-plane electric field component:
In this equation:
j is the imaginary unit;
k0 = 2πf/c is the wave number in vacuum;
c = 3·108 m/s is the speed of light;
f = 100 MHz is the frequency;
is the angle of incidence; and
corresponds to a wave incident from the positive x direction (and hence propagating in the negative x direction, from the right to the left in the model).
The time-harmonic wave equation is then solved for the relative field, Erel = E − Eb, where E is the total, measurable field.
The relative field is the difference between the measured field caused by the presence of the boat and the background field. It is utilized to describe how detectable the boat is with the radar — its RCS. The RCS of a 3D scatterer is defined as
For the 2D scatterer in this example, the RCS per unit length is used to address its monostatic scattering characteristics at the angle where the incident wave comes from, which is given by
where the relative field as a function of radius is calculated with the help of the far-field computation, Efar. The RCS of a 3D model which has a constant geometrical cross-section of a 2D model can also be estimated from the RCS per unit length by
where l is the length of a scatterer and λ is the wavelength.
Results and Discussion
Using a parametric solver, the results are for the full range of angles of incidence, from 0 to 359 degrees in 1-degree steps. Figure 2 shows the norm of the total field caused by a background plane wave incident from a 30-degree angle. The reflections on the boat create a standing wave pattern. The boat casts a shadow on the lower-left side.
Figure 2: The total field norm for a 30 degree angle of incidence. The arrow represents the propagation direction of the incident background field.
You can also visualize the relative field sent out from the boat. Figure 3 shows both its instantaneous value at a zero phase and its norm. Note that the lack of standing waves in the latter indicates that the PML does its job of absorbing the outgoing field without any reflections.
Figure 3: The instantaneous value (top) and magnitude (bottom) of the relative electric field sent out by the boat for a 30-degree angle of incidence.
As shown in these near field plots, you can guess that a distant observer would see peaks in the relative field centered around 150 and 210 degrees. This is confirmed by the far-field plot in Figure 4. The far-field computation uses the Stratton–Chu formula (see Far-Field Calculations Theory in the RF Module User’s Guide) with the relative electric field on the boundaries of the boat as the input. Note that the relative field is the only component for which it makes sense to evaluate the far field. While the relative field falls off with the distance from the boat, the incident field amplitude remains constant. Hence the total field is non-trivial only at finite distances from the boat.
Figure 4: Far-field radiation plot for a 30-degree angle of incidence. The distance to the center represents the far field in dB.
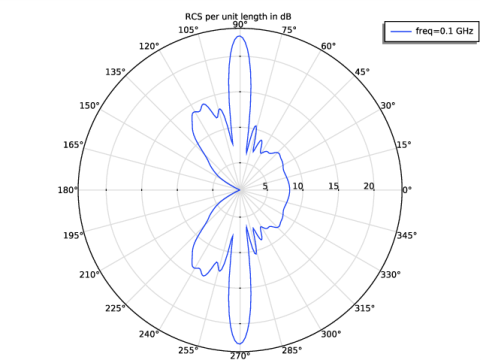
Figure 5 shows the RCS per unit length. Compared to the other plots, which show various aspects of the fields for a specific angle of incidence, this output is generally only possible by solving for the complete range of angles, from 0 to 360 degrees. In this example, you could avoid solving for half of this range by noting that because of the geometry symmetry, the results in the upper and lower half plane are identical.
Except for the symmetry, a main feature of the RCS per unit length plot is the prominent peak at 90 degrees, due to the flat side of the boat. If the radar is in this direction, much of the field that hits the boat reflects back toward it. The peak around 135 degrees is explained similarly, but the side of the bow replaces the side of the boat. This peak is lower and wider because the boundary is shorter and slightly bent. There is a dip at 180 degrees because most of the field that hits the bow from a straight angle reflects to the sides.
Figure 5: Polar plot of the RCS per unit length as a function of the angle of incidence.
Application Library path: RF_Module/Scattering_and_RCS/radar_cross_section
Modeling Instructions
From the File menu, choose New.
New
In the New window, click  Model Wizard.
Model Wizard
1
In the Model Wizard window, click  2D.
2
In the Select Physics tree, select Radio Frequency>Electromagnetic Waves, Frequency Domain (emw).
3
Click Add.
4
Click  Study.
5
In the Select Study tree, select General Studies>Frequency Domain.
6
Study 1
Step 1: Frequency Domain
1
In the Model Builder window, under Study 1 click Step 1: Frequency Domain.
2
In the Settings window for Frequency Domain, locate the Study Settings section.
3
In the Frequencies text field, type 100[MHz].
Global Definitions
Parameters 1
1
In the Model Builder window, under Global Definitions click Parameters 1.
2
In the Settings window for Parameters, locate the Parameters section.
3
Geometry 1
Circle 1 (c1)
1
In the Geometry toolbar, click  Circle.
2
In the Settings window for Circle, locate the Size and Shape section.
3
In the Radius text field, type r0+3[m].
4
Click to expand the Layers section. In the table, enter the following settings:
Circular Arc 1 (ca1)
1
In the Geometry toolbar, click  More Primitives and choose Circular Arc.
2
In the Settings window for Circular Arc, locate the Properties section.
3
From the Specify list, choose Endpoints and start angle.
4
Locate the Starting Point section. In the x text field, type 6.
5
Locate the Endpoint section. In the x text field, type 4.
6
In the y text field, type 2.
Circular Arc 2 (ca2)
1
In the Geometry toolbar, click  More Primitives and choose Circular Arc.
2
In the Settings window for Circular Arc, locate the Properties section.
3
From the Specify list, choose Endpoints and start angle.
4
Locate the Starting Point section. In the x text field, type 4.
5
In the y text field, type -2.
6
Locate the Endpoint section. In the x text field, type 6.
7
In the y text field, type 0.
8
Locate the Angles section. In the Start angle text field, type 270.
Line Segment 1 (ls1)
1
In the Geometry toolbar, click  More Primitives and choose Line Segment.
2
In the Settings window for Line Segment, locate the Starting Point section.
3
From the Specify list, choose Coordinates.
4
Locate the Endpoint section. From the Specify list, choose Coordinates.
5
Locate the Starting Point section. In the x text field, type -4.
6
In the y text field, type -2.
7
Locate the Endpoint section. In the x text field, type 4.
8
In the y text field, type -2.
Line Segment 2 (ls2)
1
In the Geometry toolbar, click  More Primitives and choose Line Segment.
2
In the Settings window for Line Segment, locate the Starting Point section.
3
From the Specify list, choose Coordinates.
4
Locate the Endpoint section. From the Specify list, choose Coordinates.
5
Locate the Starting Point section. In the x text field, type -4.
6
In the y text field, type 2.
7
Locate the Endpoint section. In the x text field, type 4.
8
In the y text field, type 2.
Quadratic Bézier 1 (qb1)
1
In the Geometry toolbar, click  More Primitives and choose Quadratic Bézier.
2
In the Settings window for Quadratic Bézier, locate the Control Points section.
3
In row 1, set x to -4 and y to 2.
4
In row 2, set x to -6 and y to 2.>
5
In row 3, set x to -8.
Quadratic Bézier 2 (qb2)
1
In the Geometry toolbar, click  More Primitives and choose Quadratic Bézier.
2
In the Settings window for Quadratic Bézier, locate the Control Points section.
3
In row 1, set x to -8.
4
In row 2, set x to -6 and y to -2.
5
In row 3, set x to -4 and y to -2.
Convert to Solid 1 (csol1)
1
In the Geometry toolbar, click  Conversions and choose Convert to Solid.
2
Select the objects ca1, ca2, ls1, ls2, qb1, and qb2 only.
Definitions
Boat Boundaries
1
In the Definitions toolbar, click  Explicit.
2
In the Settings window for Explicit, type Boat Boundaries in the Label text field.
3
4
Locate the Output Entities section. From the Output entities list, choose Adjacent boundaries.
You will select the boundaries of the boat several times throughout this tutorial. The Named Selection you just defined makes this more convenient.
Perfectly Matched Layer 1 (pml1)
1
In the Definitions toolbar, click  Perfectly Matched Layer.
2
3
In the Settings window for Perfectly Matched Layer, locate the Geometry section.
4
From the Type list, choose Cylindrical.
The PML will make sure that the scattered field from the boat is almost completely absorbed before what remains of it reflects on the exterior boundaries of the model. Note that the background field is not affected by any of this - it is by definition what you are setting it to be.
Add Material
1
In the Home toolbar, click  Add Material to open the Add Material window.
2
Go to the Add Material window.
3
4
Click Add to Component in the window toolbar.
5
In the tree, select Built-in>Aluminum.
6
Click Add to Component in the window toolbar.
7
In the Home toolbar, click  Add Material to close the Add Material window.
Materials
Aluminum (mat2)
1
In the Settings window for Material, locate the Geometric Entity Selection section.
2
From the Geometric entity level list, choose Boundary.
3
From the Selection list, choose Boat Boundaries.
Electromagnetic Waves, Frequency Domain (emw)
1
In the Model Builder window, under Component 1 (comp1) click Electromagnetic Waves, Frequency Domain (emw).
2
Because you will be using a boundary condition to represent the boat, the field inside it will be identically zero and is not necessary to solve for. Removing the boat domain this way will save time and memory.
3
In the Settings window for Electromagnetic Waves, Frequency Domain, locate the Formulation section.
4
From the list, choose Scattered field.
The option you just selected lets you enter a background field. The expression you will use, represents a plane wave coming in from an angle phi. In this expression, the wave propagation constant in vacuum, emw.k0, is automatically provided by the physics interface. Once you have solved the model, you can plot the background field to verify that you have set it up correctly.
5
Specify the Eb vector as
6
Locate the Components section. From the Electric field components solved for list, choose Out-of-plane vector.
The background field has only the z-component of electric field. By choosing the Out-of-plane vector, the computation can be more efficient.
Impedance Boundary Condition 1
1
In the Physics toolbar, click  Boundaries and choose Impedance Boundary Condition.
2
In the Settings window for Impedance Boundary Condition, locate the Boundary Selection section.
3
From the Selection list, choose Boat Boundaries.
The use of an impedance boundary condition assumes that the skin depth in the material is much less than the material thickness. At 200 MHz, the skin depth in Aluminum is of the order of microns, so it is safe to say this is the case. You could even have used a perfect electric conductor condition instead, with largely unchanged results. In the case of scattering on a nanoparticle, the skin depth is often of the same order of magnitude as the particle itself. In such situations, you should not use the impedance boundary condition but rather keep the material domain active.
Far-Field Domain 1
In the Physics toolbar, click  Domains and choose Far-Field Domain.
Mesh 1
In the Model Builder window, under Component 1 (comp1) right-click Mesh 1 and choose Build All.
Study 1
Step 1: Frequency Domain
1
In the Model Builder window, under Study 1 click Step 1: Frequency Domain.
2
In the Settings window for Frequency Domain, click to expand the Study Extensions section.
3
Select the Auxiliary sweep check box.
4
5
You are solving this model for incidence angles from 0 to 360 degrees, in steps of 1 degree. Smaller steps would give you more accurate RCS plots, but the total solution time as well as the size of the model file increases linearly with the number of angles.
6
In the Home toolbar, click  Compute.
Results
Selection 1
1
In the Model Builder window, expand the Electric Field (emw) node.
2
Right-click Surface and choose Selection.
3
4
In the Electric Field (emw) toolbar, click  Plot.
The default plot shows the norm of the total electric field for an angle of incidence equal to 360 degrees. The total electric field is the actual, measurable, physical field. The plot is dominated by a standing wave pattern caused by the reflections mainly on the stern and the sides of the boat. As you might expect with the wave coming in almost from the right, a wake is forming to the left of the boat, beyond the bow. To reproduce Figure 2, see what the field looks like with a 30 degree angle of incidence.
Electric Field (emw)
1
In the Model Builder window, click Electric Field (emw).
2
In the Settings window for 2D Plot Group, locate the Data section.
3
From the Parameter value (phi (deg)) list, choose 30.
4
In the Electric Field (emw) toolbar, click  Plot.
At 30 degrees, the wake widens. It is also possible to discern an increased field above and to the left of the boat, due to the reflections on its upper side. Try also plotting the instantaneous value of the total and the relative field.
Surface
1
In the Model Builder window, click Surface.
2
In the Settings window for Surface, click Replace Expression in the upper-right corner of the Expression section. From the menu, choose Component 1 (comp1)>Electromagnetic Waves, Frequency Domain>Electric>Electric field - V/m>emw.Ez - Electric field, z component.
3
In the Electric Field (emw) toolbar, click  Plot.
4
Click Replace Expression in the upper-right corner of the Expression section. From the menu, choose Component 1 (comp1)>Electromagnetic Waves, Frequency Domain>Electric>Relative electric field - V/m>emw.relEz - Relative electric field, z component.
5
In the Electric Field (emw) toolbar, click  Plot.
Because the relative field is the difference between the observed and the background field, its magnitude will increase both in the wake and where the total field is enhanced by reflections. This trend is even clearer if you plot the absolute value of the relative field.
6
Locate the Expression section. In the Expression text field, type abs(comp1.emw.relEz).
7
In the Electric Field (emw) toolbar, click  Plot.
The plot should now resemble the bottom plot in Figure 3. You can get a quantitative measure of how the reflected field is radiating out in different directions from a plot of the far field as a function of the angle. A common way to do this is as a polar plot. You already have a default polar plot that you can make slight changes to.
2D Far Field (emw)
1
In the Model Builder window, click 2D Far Field (emw).
2
In the Settings window for Polar Plot Group, locate the Data section.
3
From the Parameter selection (phi) list, choose From list.
4
In the Parameter values (phi (deg)) list, select 30.
Radiation Pattern 1
1
In the Model Builder window, expand the 2D Far Field (emw) node, then click Radiation Pattern 1.
2
In the Settings window for Radiation Pattern, locate the Evaluation section.
3
Find the Angles subsection. In the Number of angles text field, type 360.
4
In the 2D Far Field (emw) toolbar, click  Plot.
To conclude, create a similar plot of the monostatic RCS per unit length. While the far-field plot is for one specific angle of incidence at a time, this plot will visualize the back scattering as a function of the angle of incidence.
Polar Plot Group 3
In the Home toolbar, click  Add Plot Group and choose Polar Plot Group.
Global 1
1
Right-click Polar Plot Group 3 and choose Global.
2
In the Settings window for Global, locate the r-Axis Data section.
3
4
Locate the θ Angle Data section. From the Parameter list, choose Expression.
5
In the Expression text field, type phi.
6
Click to expand the Title section. From the Title type list, choose Manual.
7
In the Title text area, type RCS per unit length in dB.
8
In the Polar Plot Group 3 toolbar, click  Plot.