PDF

Condensation Detection in an Electronic Device with Transport and Diffusion
Introduction
This tutorial extends the Condensation Detection in an Electronic Device application by taking moist air transport and diffusion into account.
In the former application, the water vapor concentration is assumed to be homogeneous in the device. Here, you add a Moisture Transport in Air interface to study the water vapor transport and the condensation on the walls.
In addition, the amount of liquid water accumulated on the interior walls of the box due to condensation is evaluated.
Model Definition
This example is based on the one described in Condensation Detection in an Electronic Device.
A convection-diffusion equation is added to compute the vapor concentration, with a diffusion coefficient of 2.6·10-5 m2/s.
At the slit level, an open boundary condition is set with an upstream relative humidity and an upstream temperature Tustr taken from ambient data.
The amount of liquid water cl accumulated on the interior walls of the box by condensation is computed by solving the following equation:
where the evaporation flux gevap is deduced from the saturation conditions on the walls surfaces:
In supersaturation conditions, i.e. cv>csat, there is condensation on the surfaces, and the flux is negative (outgoing flux on the boundaries of the computational domain), equal to MvK(csat-cv). The liquid concentration on the surface increases.
In subsaturation conditions, i.e. cv<csat, and when there is some liquid on the surface, there is evaporation from the surfaces, and the flux is positive (ingoing flux on the boundaries of the computational domain), equal to MvK(csat-cv). The liquid concentration on the surface decreases.
In subsaturation conditions, i.e. cv<csat, and when there no liquid on the surface, the flux is null.
The evaporation rate K is set to 1 m/s. A higher value does not make significant difference on the numerical results, while increasing the numerical stiffness of the model.
Results and Discussion
Figure 1 plots the maximum relative humidity for this study together with the previous results obtained in Condensation Detection in an Electronic Device.
The blue curve represents the maximum relative humidity without moisture transport; the red curve corresponds to the maximum relative humidity with varying moisture content and transport study; and the related saturation indicators are represented in green and cyan, respectively.
Figure 1: Maximum relative humidity of the two studies over time.
In both models, saturation occurs around 3 hours, this time corresponding with the time of the highest ambient relative humidity. When vapor diffusion is modeled as instantaneous as in the first study, the period of time in which saturation occurs is underestimated. The supersaturation conditions (relative humidity over 1) observed in the first study are not reproduced when the condensation on the walls is accounted for.
In addition, when the Moisture Transport in Air interface is used to model vapor transport, a more accurate spatial representation of the vapor field is obtained. Since the vapor saturation level depends on the local values of the concentration, temperature and pressure, this improves the condensation detection.
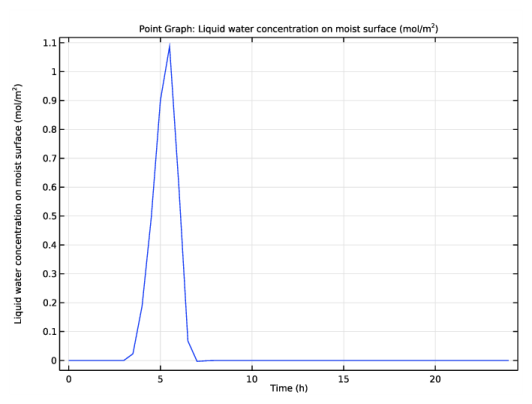
Shortly after 3 hours, the saturation conditions in the box induce condensation on its walls. The liquid water concentration begins to be positive on these surfaces, to reach its maximum at around 5 hours, then decrease again. Figure 2 shows the liquid water concentration at the left slit over time.
Figure 2: Liquid water concentration at the left slit over time.
Application Library path: Heat_Transfer_Module/Power_Electronics_and_Electronic_Cooling/condensation_electronic_device_transport_diffusion
Modeling Instructions
Root
The second part of this simulation introduces transport and diffusion of water vapor. For this purpose, you add the Moisture Transport in Air interface to solve for the concentration.
1
From the File menu, choose Open.
2
Add Physics
1
In the Home toolbar, click  Add Physics to open the Add Physics window.
2
Go to the Add Physics window.
3
In the tree, select Chemical Species Transport>Moisture Transport>Moisture Transport in Air (mt).
4
Find the Physics interfaces in study subsection. In the table, clear the Solve check box for Study 1.
5
Click Add to Component 1 in the window toolbar.
6
In the Home toolbar, click  Add Physics to close the Add Physics window.
Moisture Transport in Air (mt)
1
In the Settings window for Moisture Transport in Air, locate the Domain Selection section.
2
Click  Clear Selection.
3
Multiphysics
Heat and Moisture 1 (ham1)
1
In the Physics toolbar, click  Multiphysics Couplings and choose Domain>Heat and Moisture.
2
In the Model Builder window, click Heat and Moisture 1 (ham1).
3
Moisture Transport in Air (mt)
Initial Values 1
1
In the Model Builder window, under Component 1 (comp1)>Moisture Transport in Air (mt) click Initial Values 1.
2
In the Settings window for Initial Values, locate the Initial Values section.
3
From the φw,0 list, choose Ambient relative humidity (ampr1).
Open Boundary 1
1
In the Physics toolbar, click  Boundaries and choose Open Boundary.
2
3
In the Settings window for Open Boundary, locate the Upstream Properties section.
4
From the Tustr list, choose Ambient temperature (ampr1).
5
From the φw,ustr list, choose Ambient relative humidity (ampr1).
Add a Moist Surface feature on the interior walls of the box to account for evaporation and condensation on these surfaces, and evaluate the amount of liquid water accumulated over time.
Moist Surface 1
1
In the Physics toolbar, click  Boundaries and choose Moist Surface.
2
3
In the Settings window for Moist Surface, locate the Moist Surface Settings section.
4
In the K text field, type 1.
Multiphysics
Moisture Flow 1 (mf1)
In the Physics toolbar, click  Multiphysics Couplings and choose Domain>Moisture Flow.
Heat Transfer in Solids and Fluids (ht)
Moist Air 1
1
In the Model Builder window, expand the Component 1 (comp1)>Heat Transfer in Solids and Fluids (ht) node, then click Moist Air 1.
2
In the Settings window for Moist Air, locate the Thermodynamics, Moist Air section.
3
From the Input quantity list, choose Concentration.
4
Locate the Model Input section. From the c list, choose Vapor concentration (mt).
This step couples the Moisture Transport in Air interface to the Heat Transfer in Solids interface.
In this second study, add probe curves to the first curves with the following steps.
Definitions
Domain Probe 1 (dom1)
1
In the Model Builder window, expand the Component 1 (comp1)>Definitions node, then click Domain Probe 1 (dom1).
2
In the Settings window for Domain Probe, click to expand the Table and Window Settings section.
3
From the Output table list, choose New table.
Domain Probe 2 (dom2)
1
In the Model Builder window, click Domain Probe 2 (dom2).
2
In the Settings window for Domain Probe, locate the Table and Window Settings section.
3
From the Output table list, choose New table.
Add Study
1
In the Home toolbar, click  Add Study to open the Add Study window.
2
Go to the Add Study window.
3
Find the Studies subsection. In the Select Study tree, select General Studies>Time Dependent.
4
Click Add Study in the window toolbar.
5
In the Home toolbar, click  Add Study to close the Add Study window.
Study 2
Step 1: Time Dependent
1
In the Settings window for Time Dependent, locate the Study Settings section.
2
From the Time unit list, choose h.
3
Click  Range.
4
In the Range dialog box, type 0.5 in the Step text field.
5
In the Stop text field, type 24.
6
Click Replace.
Solution 2 (sol2)
1
In the Study toolbar, click  Show Default Solver.
2
In the Model Builder window, expand the Solution 2 (sol2) node, then click Time-Dependent Solver 1.
3
In the Settings window for Time-Dependent Solver, click to expand the Time Stepping section.
4
From the Maximum step constraint list, choose Constant.
5
In the Maximum step text field, type 0.2.
Because the temperature and pressure variations can be quick, forcing a reduced time step helps to capture all curve variations.
6
In the Study toolbar, click  Compute.
Results
Ambient Temperature
The same default plots as before are generated automatically.
To reproduce the plot in Figure 1, edit the Maximum Relative Humidity plot group. Add the curves for the saturation indicator and maximum relative humidity for this new study.
Maximum Relative Humidity
1
In the Model Builder window, click Maximum Relative Humidity.
2
In the Settings window for 1D Plot Group, click to expand the Window Settings section.
3
From the Plot window list, choose Graphics.
Probe Table Graph 1
1
In the Model Builder window, expand the Maximum Relative Humidity node, then click Probe Table Graph 1.
2
In the Settings window for Table Graph, click to expand the Legends section.
3
Probe Table Graph 2
1
In the Model Builder window, click Probe Table Graph 2.
2
In the Settings window for Table Graph, locate the Legends section.
3
From the Legends list, choose Manual.
4
Probe Table Graph 3
1
In the Model Builder window, click Probe Table Graph 3.
2
In the Settings window for Table Graph, locate the Legends section.
3
From the Legends list, choose Manual.
4
5
In the Maximum Relative Humidity toolbar, click  Plot.
Finally, create a plot showing the concentration of liquid water accumulated at the left slit over time, as in Figure 2.
Liquid water concentration over time
1
In the Home toolbar, click  Add Plot Group and choose 1D Plot Group.
2
In the Settings window for 1D Plot Group, type Liquid water concentration over time in the Label text field.
3
Locate the Data section. From the Dataset list, choose Study 2/Solution 2 (sol2).
Point Graph 1
1
Right-click Liquid water concentration over time and choose Point Graph.
2
3
In the Settings window for Point Graph, locate the y-Axis Data section.
4
In the Expression text field, type mt.cl_evap.
5
In the Liquid water concentration over time toolbar, click  Plot.