PDF

Condensation Detection in an Electronic Device
Introduction
Many systems, for example electronic devices, risk being damaged if exposed to condensation. Given an amount of moisture in the air, saturation occurs when the temperature decreases to reach the dew point, and condensation may occur on surfaces. Numerical simulations are useful for obtaining knowledge relevant for preventing the formation of condensation.
Changes in air properties are the primary cause of condensation in some systems. This example simulates the thermodynamical evolution of moist air in an electronic box with the aim of detecting whether saturation occurs when the external environment properties change. The model uses meteorological data for the air temperature, pressure, and relative humidity, measured at New York, JFK station. The property data correspond to average conditions of dry bulb temperature and high conditions of dew point temperature, observed on the 1st of June.
In this simulation, you assume the water vapor concentration to be homogeneous inside the box and equal to the external concentration. Also, the model setup neglects diffusion but considers the external concentration changes during the simulation.
Note: An extension of this application solves for an inhomogeneous concentration computed from the Moisture Transport in Air interface. It takes transport and diffusion of the water vapor into account, and evaluates the amount of liquid water accumulated on the walls over time, due to condensation and evaporation. See Condensation Detection in an Electronic Device with Transport and Diffusion.
Model Definition
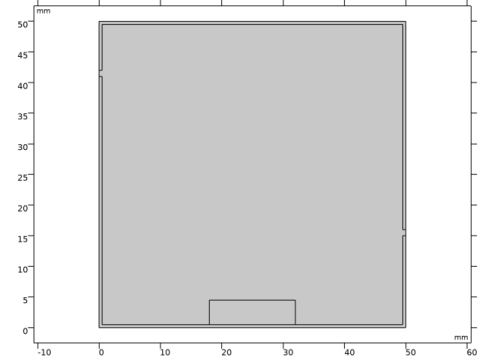
A box with square cross section of side 5 cm is placed in a moist air environment. It contains a heated electronic component and two small slits (1 mm thick) located at the left and right sides. The simulation is in a 2D cross section of the box, which is supposed to be long enough in the orthogonal direction. It is made of aluminum and the electronic component is made of silicon. Figure 1 shows the model geometry.
Figure 1: Geometry of the model.
The box is placed in a changing environment. This means that during the simulation, temperature and relative humidity change. Figure 2 shows the temperature and relative humidity as functions of time.
In this simulation, assume the moist air concentration inside the box to be equal to the external concentration.
Outside the box, you apply a convective cooling condition with a heat transfer coefficient h equal to 10 W/(m2·K) and a time-dependent external temperature equal to the ambient temperature. The central component produces a total power of 1 W during the simulation. At the slit boundaries, set a condition of open boundary to let external moist air freely enter or exit from the box.
The study computes a simulation over one day and the solution is stored every 30 minutes. The goal is to observe if some saturation appears to detect the risk of condensation.
Figure 2: Temperature and relative humidity over the course of a day.
Results and Discussion
Figure 3 shows the temperature and relative humidity profiles at the final time step.
Figure 3: Temperature and relative humidity profiles after 24 hours.
While the temperature gradient is not very large, the power dissipated from the electronic component clearly influences the temperature field: it heats the surrounding air and the walls. Cold air enters through the slits by convection. In addition, the air inside the box is cooled by conduction through the walls. The relative humidity maximum is located where the temperature is the lowest but also where the water vapor concentration is the highest.
Figure 4: Maximum relative humidity over time inside the box.
Figure 4 represents the evolution of the maximum relative humidity inside the box over the simulation period. The saturation threshold, relative humidity equals 1, is reached around 3h, meaning that saturation occurs, with a risk of condensation on the box surfaces. A Boolean saturation indicator is inserted in order to distinguish the exact saturation period. The saturation indicator is set to 1 when saturation is detected (relative humidity greater or equals to 1) and to 0 otherwise.
Application Library path: Heat_Transfer_Module/Power_Electronics_and_Electronic_Cooling/condensation_electronic_device
Modeling Instructions
From the File menu, choose New.
New
In the New window, click  Model Wizard.
Model Wizard
1
In the Model Wizard window, click  2D.
2
In the Select Physics tree, select Heat Transfer>Conjugate Heat Transfer>Laminar Flow.
3
Click Add.
4
Click  Study.
5
In the Select Study tree, select General Studies>Time Dependent.
6
Geometry 1
The geometry sequence for the model is available in a file. If you want to create it from scratch yourself, you can follow the instructions in the Geometry Modeling Instructions section. Otherwise, insert the geometry sequence as follows:
1
In the Geometry toolbar, click  Insert Sequence.
2
3
In the Geometry toolbar, click  Build All.
4
Click the  Zoom Extents button in the Graphics toolbar.
You should now see the geometry shown in Figure 1.
Materials
A material is only needed on the solid part as the fluid part is going to be defined at the feature level through the moist air functionality.
Add Material
1
In the Home toolbar, click  Add Material to open the Add Material window.
2
Go to the Add Material window.
3
In the tree, select Built-in>Aluminum.
4
Click Add to Component in the window toolbar.
5
In the tree, select Built-in>Silica glass.
6
Click Add to Component in the window toolbar.
7
In the Home toolbar, click  Add Material to close the Add Material window.
Materials
Aluminum (mat1)
1
In the Model Builder window, under Component 1 (comp1)>Materials click Aluminum (mat1).
2
Silica glass (mat2)
1
In the Model Builder window, click Silica glass (mat2).
2
Definitions
Ambient Properties 1 (ampr1)
1
In the Physics toolbar, click  Shared Properties and choose Ambient Properties.
2
In the Settings window for Ambient Properties, locate the Ambient Settings section.
3
From the Ambient data list, choose Meteorological data (ASHRAE 2013).
4
Locate the Time section. Find the Local time subsection. In the table, enter the following settings:
5
Locate the Ambient Conditions section. From the Temperature list, choose Low.
Heat Transfer in Solids and Fluids (ht)
Moist Air 1
1
In the Model Builder window, under Component 1 (comp1) right-click Heat Transfer in Solids and Fluids (ht) and choose Specific Media>Moist Air.
2
3
In the Settings window for Moist Air, locate the Thermodynamics, Moist Air section.
4
From the φw list, choose Ambient relative humidity (ampr1).
5
From the Tφw list, choose Ambient temperature (ampr1).
6
From the pφw list, choose Ambient absolute pressure (ampr1).
Initial Values 1
1
In the Model Builder window, click Initial Values 1.
2
In the Settings window for Initial Values, locate the Initial Values section.
3
From the T list, choose Ambient temperature (ampr1).
Heat Flux 1
1
In the Physics toolbar, click  Boundaries and choose Heat Flux.
2
3
In the Settings window for Heat Flux, locate the Heat Flux section.
4
Click the Convective heat flux button.
5
In the h text field, type 10.
6
From the Text list, choose Ambient temperature (ampr1).
Heat Source 1
1
In the Physics toolbar, click  Domains and choose Heat Source.
2
In the Settings window for Heat Source, locate the Domain Selection section.
3
From the Selection list, choose Electronic Component.
4
Locate the Heat Source section. Click the Heat rate button.
5
In the P0 text field, type 1.
Open Boundary 1
1
In the Physics toolbar, click  Boundaries and choose Open Boundary.
2
3
In the Settings window for Open Boundary, locate the Upstream Properties section.
4
From the Tustr list, choose Ambient temperature (ampr1).
Laminar Flow (spf)
1
In the Model Builder window, under Component 1 (comp1) click Laminar Flow (spf).
2
In the Settings window for Laminar Flow, locate the Domain Selection section.
3
From the Selection list, choose Moist Air.
4
Locate the Physical Model section. Select the Include gravity check box.
Fluid Properties 1
1
In the Model Builder window, under Component 1 (comp1)>Laminar Flow (spf) click Fluid Properties 1.
2
In the Settings window for Fluid Properties, locate the Fluid Properties section.
3
From the μ list, choose Dynamic viscosity (ht/ma1).
Initial Values 1
1
In the Model Builder window, click Initial Values 1.
2
In the Settings window for Initial Values, locate the Initial Values section.
3
In the p text field, type ampr1.p_amb-spf.pref.
Open Boundary 1
1
In the Physics toolbar, click  Boundaries and choose Open Boundary.
2
3
In the Settings window for Open Boundary, locate the Boundary Condition section.
4
In the f0 text field, type ampr1.p_amb-spf.pref.
Then, two probes are defined in order to get the maximum relative humidity and the saturation indicator at the solver time steps.
Definitions
Domain Probe 1 (dom1)
1
In the Definitions toolbar, click  Probes and choose Domain Probe.
2
In the Settings window for Domain Probe, locate the Source Selection section.
3
Click  Clear Selection.
4
From the Selection list, choose Moist Air.
5
Locate the Probe Type section. From the Type list, choose Maximum.
6
Click Replace Expression in the upper-right corner of the Expression section. From the menu, choose Component 1 (comp1)>Heat Transfer in Solids and Fluids>Moist air>ht.phi - Relative humidity.
Domain Probe 2 (dom2)
1
In the Definitions toolbar, click  Probes and choose Domain Probe.
2
In the Settings window for Domain Probe, locate the Source Selection section.
3
Click  Clear Selection.
4
From the Selection list, choose Moist Air.
5
Locate the Probe Type section. From the Type list, choose Maximum.
6
Click Replace Expression in the upper-right corner of the Expression section. From the menu, choose Component 1 (comp1)>Heat Transfer in Solids and Fluids>Moist air>ht.satInd - Saturation indicator.
Study 1
Step 1: Time Dependent
1
In the Model Builder window, under Study 1 click Step 1: Time Dependent.
2
In the Settings window for Time Dependent, locate the Study Settings section.
3
From the Time unit list, choose h.
4
Click  Range.
5
In the Range dialog box, type 0.5 in the Step text field.
6
In the Stop text field, type 24.
7
Click Replace.
8
In the Settings window for Time Dependent, locate the Study Settings section.
9
From the Tolerance list, choose User controlled.
10
In the Relative tolerance text field, type 0.0005.
Setting a lower relative tolerance avoids overshoots in the relative humidity solution at the beginning of the simulation.
Solution 1 (sol1)
1
In the Study toolbar, click  Show Default Solver.
2
In the Model Builder window, expand the Solution 1 (sol1) node, then click Time-Dependent Solver 1.
3
In the Settings window for Time-Dependent Solver, click to expand the Time Stepping section.
4
From the Maximum step constraint list, choose Constant.
5
In the Maximum step text field, type 0.25.
Because the temperature and pressure variations can be quick, forcing a reduced time step helps to capture all curve variations.
6
In the Study toolbar, click  Compute.
Results
Temperature (ht)
This default plot represents the temperature profile at the last time step, as shown in the top panel of Figure 3.
Velocity (spf)
This default plot shows the velocity profile at the last time step.
Relative Humidity
1
In the Home toolbar, click  Add Plot Group and choose 2D Plot Group.
2
In the Settings window for 2D Plot Group, type Relative Humidity in the Label text field.
Surface 1
1
In the Relative Humidity toolbar, click  Surface.
2
In the Settings window for Surface, click Replace Expression in the upper-right corner of the Expression section. From the menu, choose Component 1 (comp1)>Heat Transfer in Solids and Fluids>Moist air>ht.phi - Relative humidity.
3
In the Relative Humidity toolbar, click  Plot.
Compare with the relative humidity profile in the bottom panel of Figure 3.
Maximum Relative Humidity
Follow the steps below to reproduce the relative humidity evolution shown in Figure 4.
1
In the Model Builder window, under Results click Probe Plot Group 5.
2
In the Settings window for 1D Plot Group, type Maximum Relative Humidity in the Label text field.
Probe Table Graph 1
1
In the Model Builder window, expand the Maximum Relative Humidity node, then click Probe Table Graph 1.
2
In the Settings window for Table Graph, click to expand the Legends section.
3
From the Legends list, choose Manual.
4
Maximum Relative Humidity
1
In the Model Builder window, click Maximum Relative Humidity.
2
In the Settings window for 1D Plot Group, locate the Legend section.
3
From the Position list, choose Lower right.
4
Click to expand the Window Settings section. From the Plot window list, choose Graphics.
5
In the Maximum Relative Humidity toolbar, click  Plot.
Finally, plot the ambient temperature and relative humidity to reproduce Figure 2.
Ambient Temperature
1
In the Home toolbar, click  Add Plot Group and choose 1D Plot Group.
2
In the Settings window for 1D Plot Group, type Ambient Temperature in the Label text field.
3
Click to expand the Title section. From the Title type list, choose Manual.
4
In the Title text area, type ampr1.T_amb (K).
Point Graph 1
1
Right-click Ambient Temperature and choose Point Graph.
2
3
In the Settings window for Point Graph, locate the y-Axis Data section.
4
In the Expression text field, type ampr1.T_amb.
5
In the Ambient Temperature toolbar, click  Plot.
This figure should look like the left curve of Figure 2.
Ambient Relative Humidity
1
In the Home toolbar, click  Add Plot Group and choose 1D Plot Group.
2
In the Settings window for 1D Plot Group, type Ambient Relative Humidity in the Label text field.
3
Locate the Title section. From the Title type list, choose Manual.
4
In the Title text area, type ampr1.phi_amb (1).
Point Graph 1
1
Right-click Ambient Relative Humidity and choose Point Graph.
2
3
In the Settings window for Point Graph, locate the y-Axis Data section.
4
In the Expression text field, type ampr1.phi_amb.
5
In the Ambient Relative Humidity toolbar, click  Plot.
This figure should look like the right curve of Figure 2.
Geometry Modeling Instructions
If you want to create the geometry yourself, follow these steps.
Geometry 1
1
In the Model Builder window, under Component 1 (comp1) click Geometry 1.
2
In the Settings window for Geometry, locate the Units section.
3
From the Length unit list, choose mm.
Square 1 (sq1)
1
In the Geometry toolbar, click  Square.
2
In the Settings window for Square, locate the Size section.
3
In the Side length text field, type 50.
Square 2 (sq2)
1
In the Geometry toolbar, click  Square.
2
In the Settings window for Square, locate the Size section.
3
In the Side length text field, type 49.
4
Locate the Position section. In the x text field, type 0.5.
5
In the y text field, type 0.5.
Electronic Component
1
In the Geometry toolbar, click  Rectangle.
2
In the Settings window for Rectangle, type Electronic Component in the Label text field.
3
Locate the Size and Shape section. In the Width text field, type 14.
4
In the Height text field, type 4.
5
Locate the Position section. In the x text field, type 18.
6
In the y text field, type 0.5.
7
Locate the Selections of Resulting Entities section. Select the Resulting objects selection check box.
Rectangle 2 (r2)
1
In the Geometry toolbar, click  Rectangle.
2
In the Settings window for Rectangle, locate the Size and Shape section.
3
In the Width text field, type 0.5.
4
Locate the Position section. In the y text field, type 41.
Rectangle 3 (r3)
1
Right-click Rectangle 2 (r2) and choose Duplicate.
2
In the Settings window for Rectangle, locate the Position section.
3
In the x text field, type 49.5.
4
In the y text field, type 15.
Union 1 (uni1)
1
In the Geometry toolbar, click  Booleans and Partitions and choose Union.
2
Select the objects r2, r3, and sq2 only.
3
In the Settings window for Union, locate the Union section.
4
Clear the Keep interior boundaries check box.
Form Union (fin)
1
In the Model Builder window, click Form Union (fin).
2
In the Settings window for Form Union/Assembly, click  Build Selected.
Moist Air
1
In the Geometry toolbar, click  Selections and choose Explicit Selection.
2
In the Settings window for Explicit Selection, type Moist Air in the Label text field.
3
On the object fin, select Domain 2 only.