PDF

Species Transport in the Gas Diffusion Layers of a PEM
Introduction
This example focuses on the species transport within the gas diffusion layers (GDLs) of a proton exchange membrane (PEM) fuel cell. The geometry models a cell with two adjacent flow channels of different pressures, a situation that may occur in a cell with serpentine flow channels, or in a cell using a interdigitated flow field design. The model uses current balances, mass transport equations (Maxwell-Stefan diffusion for reactants, water and nitrogen gas), and momentum transport (Darcy’s law for the gas flows) to simulate a PEM fuel cell’s behavior.
Model Definition
The modeled section of the fuel cell consists of three domains: an anode (Ωa), a proton exchange membrane (Ωm), and a cathode (Ωc) as indicated in Figure 1.
Figure 1: Model geometry with domain and boundary labels.
Each of the electrodes (gas diffusion layers) is in contact with an interdigitated gas distributor, which has an inlet channel (∂Ωa,inlet), a current collector (∂Ωa,cc), and an outlet channel (∂Ωa,outlet). The same notation is used for the cathode side.
Humidified hydrogen and air are supplied to the inlet channels of the anode and cathode, respectively. Hydrogen reacts and is consumed at the anodic active layer to form protons that carry the ionic current to the cathode. Each proton is assumed to drag three molecules of water from the anode to the cathode, resulting in the following reaction formula for the anode:
(1)
Where λH2O is the number of water molecules that are transported per proton through the membrane by water-proton interaction.
At the cathode, oxygen reacts together with the protons to form water at the active layer according to:
(2)
Both feed gases (humidified hydrogen and humidified air) are treated as ideal and are transported through diffusion and convection. The electrodes are treated as homogeneous porous media with uniform morphological properties such as porosity and permeability. The gas within each of the electrodes exists as a continuous phase so Darcy’s law applies.
An agglomerate model describes the electrode reactions in the active catalyst layers. The agglomerates consist of catalyst and carbon particles embedded in polymer electrolyte. The equations for the agglomerate model originate from the analytical solution of a diffusion-reaction problem in a spherical porous particle (Ref. 5 and Ref. 6). At the anodic active catalyst layer, hydrogen is the diffusing and reacting species in the agglomerates, while oxygen is the diffusing and reacting species in the agglomerates at the cathode. An agglomerate model of the cathodic active catalyst layer of a PEM fuel cell has been presented by Broka and others (Ref. 7 and Ref. 8).
Charge Balances
The Hydrogen Fuel Cell interface is used for modeling the potential distributions in the three domains, with the charge-transfer current density of the active layers described as interior boundary conditions, using Thin H2/O2 Gas Diffusion Electrode nodes. The local current density expressions for the anode and cathode, ia and ic, are specified according to the equation
where the index e stands for “a” (anode) or “c” (cathode), Ragg is the agglomerate radius (SI unit: m) and jagg,a and jagg,c (SI unit: A/m3) are the current densities given by the agglomerate model. Further, Lact is the active layer (thin gas diffusion electrode) thickness (m) and εmac its porosity (the macroscopic porosity). The specific surface area of the thin gas diffusion electrode (SI unit: 1/m) is specified according to the following equation as
Agglomerate Model for Anode and Cathode
The agglomerate model describes the current density in an active layer consisting of agglomerates of ionic conductor material and electrically conducting particles covered partially with catalyst. The local current density can be expressed analytically by solving a combination of the diffusion equation and the Butler-Volmer electrode kinetic equation for an agglomerate with constant electric and ionic potentials. The resulting equations for the current density in the anode and cathode are (Ref. 7)
where, again, the index e stands for “a” (anode) or “c” (cathode), and
In these equations, Dagg is the agglomerate gas diffusivity (SI unit: m2/s), ne is a “charge transfer” number (1 for the anode and –2 for the cathode), S is the specific area of the catalyst inside the agglomerate (SI unit: 1/m), and F is Faraday’s constant (SI unit: C/mol). Furthermore, ci,ref are the reference concentrations of the species (SI unit: mol/m3), ci,agg are the corresponding concentrations in the agglomerate surface (SI unit: mol/m3), i0a and i0c are the exchange current densities (SI unit: A/m2), R is the gas constant, T is the temperature (SI unit: K), and the overvoltages at the anode and the cathode are given by
where Eeq (SI unit: V) denotes the equilibrium voltage.
You set the anodic and cathodic reference states equal to the molar fractions at the inlet channels of the anode and cathode, respectively, at 1 atm. The dissolved hydrogen and oxygen concentrations at the surface of the agglomerates are related to the molar fractions of the respective species in the gas phase through Henry’s law
where K is Henry’s constant (SI unit: Pa·m3/mol).
Charge Balances, Continued
The potential difference between the cathode and anode current collectors corresponds to the total cell voltage. Choose the potential at the anode current collector as the reference level by setting it to zero. Then the total cell voltage serves as the boundary condition at the cathode current collector:
For the other boundaries you have electric insulation boundary conditions.
Porous Media Fluid Flow
To model the gas flows in the gas backings, this example uses the Darcy’s law in the Hydrogen Fuel Cell interface. The gas velocity is given by the continuity equation according to
where ρ is the mixture density of the gas phase (SI unit: kg/m3) and u denotes the gas velocity (SI unit: m/s). Darcy’s law for porous media states that the gradient of pressure, the viscosity of the fluid, and the structure of the porous media determine the velocity:
Here kp denotes the electrode’s permeability (SI unit: m2), η represents the gas viscosity (SI unit: Pa·s), and p is the pressure (SI unit: Pa). The ideal gas law gives the gas phase’s mixture density, ρ:
(3)
In this equation, R denotes the gas constant (SI unit: J/(mol·K)), T is the temperature (SI unit: K), M is the molar mass (SI unit: kg/mol), and x is the mole fraction.
At the inlets and outlets you specify the pressure:
At the thin gas diffusion electrode boundary for the anode and cathode, the gas velocity is calculated automatically by the Hydrogen Fuel Cell interface, from the total mass flow given by the electrochemical reaction rate and the stoichiometric coefficients of Equation 1 and Equation 2, using Faraday’s law.
Maxwell-Stefan Mass Transport
The model takes into account two species in the anode — H2 and H2O — and three at the cathode — O2, H2O, and N2. The Hydrogen Fuel Cell interface uses Maxwell-Stefan multicomponent diffusion governed by the following equation
o solve for the mass fractions, wi. This particular PEM fuel cell model assumes that the temperature-driven diffusion is insignificant and sets the source term, R, to zero. The Maxwell-Stefan binary diffusion coefficients, Dij (SI unit: m2/s), are calculated automatically by the interface.
The feed-gas mole fractions are specified at the inlets. At the outlets, convective flux boundary conditions are applied, meaning that the flux is convection dominated. At the thin gas diffusion electrode boundaries, the mass fluxes of the species are automatically determined from the electrochemical reaction rate and stoichiometric coefficients, using Faraday’s law. The Stefan velocity contributions are also automatically calculated by the interface.
Results and Discussion
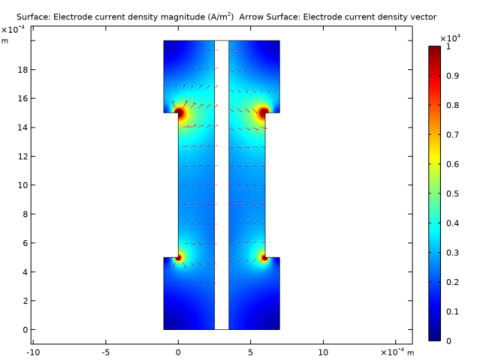
Figure 2 shows the current distribution in the PEM fuel cell. There are significant current spikes present at the corners of the current collectors.
Figure 2: Current density (surface plot) and current vector field (arrow plot) in the fuel cell operating at 0.7 V. The anode is on the left and the cathode is on the right.
To further analyze the cell’s behavior, plot the current density at the active layer as a function of cell height (y) as in Figure 3.
Figure 3: Current-density distribution at the active layer at the anode.
The current density is uneven with the highest density in the cell’s upper region. This means that the oxygen-reduction reaction rate in the cathode determines the current-density distribution. The maximum current density arises close to the air inlet.
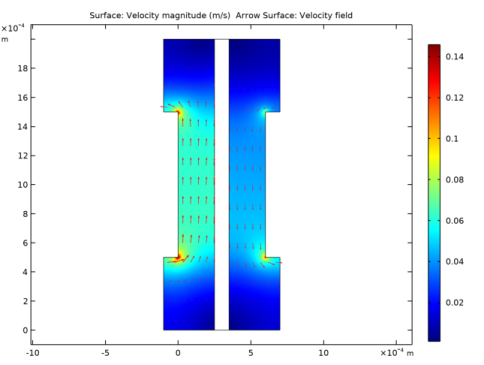
The convective fluxes generally dominate mass transport in the cell. To study the convective effects, plot the velocity field as in Figure 4.
Figure 4: Gas velocity field in the anode and cathode compartments.
The flow-velocity magnitude attains its highest values at the current collector corners.
Figure 5 shows the reactant (oxygen and hydrogen) weight fractions in the cathode and anode gases. Surprisingly, the hydrogen fraction increases as the anode gas flows from the inlet (at the bottom) to the outlet (at the top). This is the result of the electro-osmotic drag of water through the membrane, which results in a higher flux than the consumption of hydrogen. This means that the resulting convective flux of anode gas toward the membrane causes the weight fraction of hydrogen to go up. In the cathode gas, there is an expected decrease in oxygen content along the flow direction.
Figure 5: Reactant mass fractions, normalized by their inlet values, on the anode side (left) and cathode side (right). The reactant in the anode is hydrogen and that in the cathode is oxygen.
Although oxygen consumption is small, the concentration overvoltage in the agglomerates gives a substantial contribution to the concentration overvoltage. A small change in the oxygen flow gives a substantial change in cell polarization.
Figure 6 depicts the water mass fraction in the anode and cathode gases as well as the diffusive flux of water in the anode. It is apparent that water is transported through both diffusion and convection to the membrane on the anode side. The results show a minimum occurring in the upper corner of the membrane on the anode side. This is known to limit fuel cell performance. If the anode gas becomes too dry, the membrane dries out, resulting in decreasing ionic conductivity and the cell subsequently fails.
On the other hand, on the cathode side water levels increase with the direction of flow, and a local maximum in water current occurs in the lower corner to the membrane. This might also be critical because water droplets can clog the pores and effectively hinder gas transport to the active layer.
Figure 6: Water mass fraction in the anode (left, surface plot) and the cathode (right, contour plot).
References
1. W. He, J.S. Yi, and T.V. Nguyen, “Two-Phase Flow Model of the Cathode of PEM Fuel Cells Using Interdigitated Flow Fields,” AIChe J., vol. 46, pp. 2053–2063, 2000.
2. C. Marr and X. Li, “Composition and Performance Modelling of Catalyst Layer in a Proton Exchange Membrane Fuel Cell,” J. Power Sources, vol. 77, pp. 17–27, 1999.
3. P. Futerko and I.-M. Hsing, “Two-Dimensional Finite Element Method Study of the Resistance of Membranes in Polymer Electrolyte Fuel Cells,” Electrochimica Acta, vol. 45, pp. 1741–1751, 2000.
4. D.M. Bernardi and M.W. Verbrugge, “Mathematical Model of a Gas Diffusion Electrode Bonded to a Polymer Electrolyte,” AIChe J., vol. 37, pp. 1151–1163, 1991.
5. H. Scott Fogler, Elements of Chemical Reaction Engineering, 3rd ed., Prentice Hall, 1999.
6. R.B. Bird, W.E. Stewart, and E.N. Lightfoot, Transport Phenomena, John Wiley & Sons, 1960.
7. K. Broka and P. Ekdunge, “Modelling the PEM fuel cell cathode,” J. Appl. Electrochem., vol. 27, pp. 281–289, 1997.
8. K. Dannenberg, P. Ekdunge, and G. Lindbergh, “Mathematical model of the PEMFC”, J. Appl. Electrochem., vol. 30, pp. 1377–1387, 2000.
Application Library path: Fuel_Cell_and_Electrolyzer_Module/Fuel_Cells/pem_gdl_species_transport_2d
Modeling Instructions
From the File menu, choose New.
New
In the New window, click  Model Wizard.
Model Wizard
1
In the Model Wizard window, click  2D.
2
In the Select Physics tree, select Electrochemistry>Hydrogen Fuel Cells>Proton Exchange (fc).
3
Click Add.
4
Click  Study.
5
In the Select Study tree, select Preset Studies for Selected Physics Interfaces>Stationary with Initialization.
6
Geometry 1
Create the geometry using rectangles.
Rectangle 1 (r1)
1
In the Geometry toolbar, click  Rectangle.
2
In the Settings window for Rectangle, locate the Size and Shape section.
3
In the Width text field, type 2.5e-4.
4
In the Height text field, type 2e-3.
Rectangle 2 (r2)
1
In the Geometry toolbar, click  Rectangle.
2
In the Settings window for Rectangle, locate the Size and Shape section.
3
In the Width text field, type 1e-4.
4
In the Height text field, type 2e-3.
5
Locate the Position section. In the x text field, type 2.5e-4.
Rectangle 3 (r3)
1
In the Geometry toolbar, click  Rectangle.
2
In the Settings window for Rectangle, locate the Size and Shape section.
3
In the Width text field, type 2.5e-4.
4
In the Height text field, type 2e-3.
5
Locate the Position section. In the x text field, type 3.5e-4.
Rectangle 4 (r4)
1
In the Geometry toolbar, click  Rectangle.
2
In the Settings window for Rectangle, locate the Size and Shape section.
3
In the Width text field, type 1e-4.
4
In the Height text field, type 5e-4.
5
Locate the Position section. In the x text field, type -1e-4.
Array 1 (arr1)
1
In the Geometry toolbar, click  Transforms and choose Array.
2
3
In the Settings window for Array, locate the Size section.
4
In the x size text field, type 2.
5
In the y size text field, type 2.
6
Locate the Displacement section. In the x text field, type 7e-4.
7
In the y text field, type 1.5e-3.
Union 1 (uni1)
1
In the Geometry toolbar, click  Booleans and Partitions and choose Union.
2
Select the objects arr1(1,1), arr1(1,2), and r1 only.
3
In the Settings window for Union, locate the Union section.
4
Clear the Keep interior boundaries check box.
Union 2 (uni2)
1
In the Geometry toolbar, click  Booleans and Partitions and choose Union.
2
Select the objects arr1(2,1), arr1(2,2), and r3 only.
3
In the Settings window for Union, locate the Union section.
4
Clear the Keep interior boundaries check box.
5
In the Geometry toolbar, click  Build All.
Global Definitions
Proceed to load a set of global model parameters from a text file provided with the Application Library.
Parameters 1
1
In the Model Builder window, under Global Definitions click Parameters 1.
2
In the Settings window for Parameters, locate the Parameters section.
3
Click  Load from File.
4
Definitions
Set up a number of selections on the geometry. These will be used later when setting up the physics.
Anode GDL
1
In the Definitions toolbar, click  Explicit.
2
3
Right-click Explicit 1 and choose Rename.
4
In the Rename Explicit dialog box, type Anode GDL in the New label text field.
5
Membrane
1
In the Definitions toolbar, click  Explicit.
2
3
Right-click Explicit 2 and choose Rename.
4
In the Rename Explicit dialog box, type Membrane in the New label text field.
5
Cathode GDL
1
In the Definitions toolbar, click  Explicit.
2
3
Right-click Explicit 3 and choose Rename.
4
In the Rename Explicit dialog box, type Cathode GDL in the New label text field.
5
Anode GDE
1
In the Definitions toolbar, click  Explicit.
2
In the Settings window for Explicit, locate the Input Entities section.
3
From the Geometric entity level list, choose Boundary.
4
5
Right-click Explicit 4 and choose Rename.
6
In the Rename Explicit dialog box, type Anode GDE in the New label text field.
7
Cathode GDE
1
In the Definitions toolbar, click  Explicit.
2
In the Settings window for Explicit, locate the Input Entities section.
3
From the Geometric entity level list, choose Boundary.
4
5
Right-click Explicit 5 and choose Rename.
6
In the Rename Explicit dialog box, type Cathode GDE in the New label text field.
7
Anode GDL Variables
Define a number of domain- and boundary-specific variables. These will be used both for setting up the physics and in postprocessing.
1
In the Definitions toolbar, click  Local Variables.
2
In the Model Builder window, right-click Variables 1 and choose Rename.
3
In the Rename Variables dialog box, type Anode GDL Variables in the New label text field.
4
5
In the Settings window for Variables, locate the Geometric Entity Selection section.
6
From the Geometric entity level list, choose Domain.
7
From the Selection list, choose Anode GDL.
8
Locate the Variables section. In the table, enter the following settings:
Cathode GDL Variables
1
In the Definitions toolbar, click  Local Variables.
2
Right-click Variables 2 and choose Rename.
3
In the Rename Variables dialog box, type Cathode GDL Variables in the New label text field.
4
5
In the Settings window for Variables, locate the Geometric Entity Selection section.
6
From the Geometric entity level list, choose Domain.
7
From the Selection list, choose Cathode GDL.
8
Locate the Variables section. In the table, enter the following settings:
Anode GDE Variables
1
In the Definitions toolbar, click  Local Variables.
2
In the Model Builder window, right-click Variables 3 and choose Rename.
3
In the Rename Variables dialog box, type Anode GDE Variables in the New label text field.
4
5
In the Settings window for Variables, locate the Geometric Entity Selection section.
6
From the Geometric entity level list, choose Boundary.
7
From the Selection list, choose Anode GDE.
8
Locate the Variables section. In the table, enter the following settings:
Cathode GDE Variables
1
In the Definitions toolbar, click  Local Variables.
2
Right-click Variables 4 and choose Rename.
3
In the Rename Variables dialog box, type Cathode GDE Variables in the New label text field.
4
5
In the Settings window for Variables, locate the Geometric Entity Selection section.
6
From the Geometric entity level list, choose Boundary.
7
From the Selection list, choose Cathode GDE.
8
Locate the Variables section. In the table, enter the following settings:
Hydrogen Fuel Cell (fc)
Set up the current distribution and transport model. Include mass transport using Maxwell-Stefan diffusion and momentum transport using Darcy’s Law in both the anode and cathode gas mixtures. Also, define the reference pressure level in the interface properties. Note that the default gas species are hydrogen and water on the anode side, and oxygen, nitrogen and water on the cathode side. Start with adding the relevant domain nodes.
1
In the Settings window for Hydrogen Fuel Cell, locate the H2 Gas Mixture section.
2
Find the Transport mechanisms subsection. Select the Use Darcy’s Law for momentum transport check box.
3
Locate the O2 Gas Mixture section. Select the Use Darcy’s Law for momentum transport check box.
4
Click to expand the Reference Pressure Level section. In the pref text field, type 0.
Membrane 1
1
Right-click Component 1 (comp1)>Hydrogen Fuel Cell (fc) and choose Membrane.
2
In the Settings window for Membrane, locate the Domain Selection section.
3
From the Selection list, choose Membrane.
H2 Gas Diffusion Layer 1
1
In the Physics toolbar, click  Domains and choose H2 Gas Diffusion Layer.
2
In the Settings window for H2 Gas Diffusion Layer, locate the Domain Selection section.
3
From the Selection list, choose Anode GDL.
O2 Gas Diffusion Layer 1
1
In the Physics toolbar, click  Domains and choose O2 Gas Diffusion Layer.
2
In the Settings window for O2 Gas Diffusion Layer, locate the Domain Selection section.
3
From the Selection list, choose Cathode GDL.
Thin H2 Gas Diffusion Electrode 1
1
In the Physics toolbar, click  Boundaries and choose Thin H2 Gas Diffusion Electrode.
2
In the Settings window for Thin H2 Gas Diffusion Electrode, locate the Boundary Selection section.
3
From the Selection list, choose Anode GDE.
Thin O2 Gas Diffusion Electrode 1
1
In the Physics toolbar, click  Boundaries and choose Thin O2 Gas Diffusion Electrode.
2
In the Settings window for Thin O2 Gas Diffusion Electrode, locate the Boundary Selection section.
3
From the Selection list, choose Cathode GDE.
Electrolyte Phase 1
Set up the electrolyte conductivity in the Electrolyte Phase node.
1
In the Model Builder window, click Electrolyte Phase 1.
2
In the Settings window for Electrolyte Phase, locate the Electrolyte Charge Transport section.
3
In the σl text field, type kappa_m.
Inspect the settings in the H2 Gas Phase and O2 Gas Phase nodes. Note that the density and viscosity of the gas mixture, and the binary diffusion coefficients are calculated automatically when the respective default settings are used.
H2 Gas Diffusion Layer 1
Set up the properties of the H2 Gas Diffusion Layer and O2 Gas Diffusion Layer nodes.
1
In the Model Builder window, click H2 Gas Diffusion Layer 1.
2
In the Settings window for H2 Gas Diffusion Layer, locate the Electrode Charge Transport section.
3
In the σs text field, type kappa_s.
4
Locate the Gas Transport section. In the εg text field, type eps_mac.
5
In the κg text field, type kappa_p.
O2 Gas Diffusion Layer 1
1
In the Model Builder window, click O2 Gas Diffusion Layer 1.
2
In the Settings window for O2 Gas Diffusion Layer, locate the Electrode Charge Transport section.
3
In the σs text field, type kappa_s.
4
Locate the Gas Transport section. In the εg text field, type eps_mac.
5
In the κg text field, type kappa_p.
Thin H2 Gas Diffusion Electrode 1
Set up the properties of the Thin H2 Gas Diffusion Electrode node. The details of electrode kinetics are set in the child node.
1
In the Model Builder window, click Thin H2 Gas Diffusion Electrode 1.
2
In the Settings window for Thin H2 Gas Diffusion Electrode, locate the Electrode Thickness section.
3
In the dgde text field, type l_act.
Thin H2 Gas Diffusion Electrode Reaction 1
1
In the Model Builder window, expand the Thin H2 Gas Diffusion Electrode 1 node, then click Thin H2 Gas Diffusion Electrode Reaction 1.
2
In the Settings window for Thin H2 Gas Diffusion Electrode Reaction, locate the Stoichiometric Coefficients section.
3
In the νH2O text field, type 2*drag.
4
Locate the Equilibrium Potential section. From the Eeq list, choose User defined. Locate the Electrode Kinetics section. From the iloc,expr list, choose User defined. In the associated text field, type i_a.
5
Locate the Active Specific Surface Area section. In the av text field, type Av.
Thin O2 Gas Diffusion Electrode 1
Similarly, set up the properties of the Thin O2 Gas Diffusion Electrode node. The details of electrode kinetics are set in the child node.
1
In the Model Builder window, click Thin O2 Gas Diffusion Electrode 1.
2
In the Settings window for Thin O2 Gas Diffusion Electrode, locate the Electrode Thickness section.
3
In the dgde text field, type l_act.
Thin O2 Gas Diffusion Electrode Reaction 1
1
In the Model Builder window, expand the Thin O2 Gas Diffusion Electrode 1 node, then click Thin O2 Gas Diffusion Electrode Reaction 1.
2
In the Settings window for Thin O2 Gas Diffusion Electrode Reaction, locate the Stoichiometric Coefficients section.
3
In the νH2O text field, type 2+4*drag.
4
Locate the Equilibrium Potential section. From the Eeq list, choose User defined. Locate the Electrode Kinetics section. From the iloc,expr list, choose User defined. In the associated text field, type i_c.
5
Locate the Active Specific Surface Area section. In the av text field, type Av.
Finally, set up the boundary conditions and initial values.
Electronic Conducting Phase 1
Set the initial value for electric potential in the cathode electrode to the cell potential. (The default zero initial values are used for both potentials in the rest of the geometry.)
1
In the Model Builder window, click Electronic Conducting Phase 1.
Initial Values, O2 Domains 1
1
In the Physics toolbar, click  Attributes and choose Initial Values, O2 Domains.
2
3
In the Settings window for Initial Values, O2 Domains, locate the Initial Values section.
4
In the φs text field, type V_cell.
Electronic Conducting Phase 1
In the Model Builder window, click Electronic Conducting Phase 1.
Electric Ground 1
1
In the Physics toolbar, click  Attributes and choose Electric Ground.
2
Electronic Conducting Phase 1
In the Model Builder window, click Electronic Conducting Phase 1.
Electric Potential 1
1
In the Physics toolbar, click  Attributes and choose Electric Potential.
2
3
In the Settings window for Electric Potential, locate the Electric Potential section.
4
In the φs,bnd text field, type V_cell.
H2 Gas Phase 1
In the Model Builder window, click H2 Gas Phase 1.
H2 Inlet 1
1
In the Physics toolbar, click  Attributes and choose H2 Inlet.
2
3
In the Settings window for H2 Inlet, locate the Mixture Specification section.
4
In the x0,H2O text field, type xH2Oa_in.
5
Locate the Flow Boundary Condition section. In the p0 text field, type p_a_in.
H2 Gas Phase 1
In the Model Builder window, click H2 Gas Phase 1.
H2 Outlet 1
1
In the Physics toolbar, click  Attributes and choose H2 Outlet.
2
3
In the Settings window for H2 Outlet, locate the Outlet section.
4
In the p0 text field, type p_ref.
Initial Values 1
1
In the Model Builder window, click Initial Values 1.
2
In the Settings window for Initial Values, locate the Initial Values section.
3
In the x0,H2O text field, type xH2Oa_in.
4
In the p0 text field, type p_ref.
O2 Gas Phase 1
In the Model Builder window, click O2 Gas Phase 1.
O2 Inlet 1
1
In the Physics toolbar, click  Attributes and choose O2 Inlet.
2
3
In the Settings window for O2 Inlet, locate the Mixture Specification section.
4
In the x0,H2O text field, type xH2Oc_in.
5
In the x0,N2 text field, type xN2_in.
6
Locate the Flow Boundary Condition section. In the p0 text field, type p_c_in.
O2 Gas Phase 1
In the Model Builder window, click O2 Gas Phase 1.
O2 Outlet 1
1
In the Physics toolbar, click  Attributes and choose O2 Outlet.
2
3
In the Settings window for O2 Outlet, locate the Outlet section.
4
In the p0 text field, type p_ref.
Initial Values 1
1
In the Model Builder window, click Initial Values 1.
2
In the Settings window for Initial Values, locate the Initial Values section.
3
In the x0,H2O text field, type xH2Oc_in.
4
In the x0,N2 text field, type xN2_in.
5
In the p0 text field, type p_ref.
Global Definitions
Default Model Inputs
Since we will be using the same temperature everywhere in the model, we will define the temperature only once in the Default Model Inputs node. This node may be accessed by multiple physics nodes.
1
In the Model Builder window, under Global Definitions click Default Model Inputs.
2
In the Settings window for Default Model Inputs, locate the Browse Model Inputs section.
3
In the tree, select General>Temperature (K) - minput.T.
4
Find the Expression for remaining selection subsection. In the Temperature text field, type T.
Mesh 1
Steep gradients are expected close to the electrodes and at the corner points where the ribs of the flow plates are suppressed into the GDL. Create a mesh with finer resolution at these parts of the geometry.
Size 1
1
In the Model Builder window, under Component 1 (comp1) right-click Mesh 1 and choose Size.
2
In the Settings window for Size, locate the Geometric Entity Selection section.
3
From the Geometric entity level list, choose Boundary.
4
5
Locate the Element Size section. Click the Custom button.
6
Locate the Element Size Parameters section. Select the Maximum element size check box.
7
Size 2
1
In the Model Builder window, right-click Mesh 1 and choose Size.
2
In the Settings window for Size, locate the Geometric Entity Selection section.
3
From the Geometric entity level list, choose Point.
4
5
Locate the Element Size section. Click the Custom button.
6
Locate the Element Size Parameters section. Select the Maximum element size check box.
7
Free Triangular 1
1
In the Mesh toolbar, click  Free Triangular.
2
Right-click Mesh 1 and choose Build All.
The finalized mesh should now look as follows:
Study 1
The problem is now ready for solving. In the first step, solve for secondary current distribution initialization.
Step 1: Current Distribution Initialization
1
In the Model Builder window, under Study 1 click Step 1: Current Distribution Initialization.
2
In the Settings window for Current Distribution Initialization, locate the Study Settings section.
3
From the Current distribution type list, choose Secondary.
4
In the Home toolbar, click  Compute.
Results
The following steps reproduce the figures found in the Results and Discussion section.
GDL Current Density Distribution
1
In the Home toolbar, click  Add Plot Group and choose 2D Plot Group.
2
In the Settings window for 2D Plot Group, type GDL Current Density Distribution in the Label text field.
Surface 1
1
Right-click GDL Current Density Distribution and choose Surface.
2
In the Settings window for Surface, click Replace Expression in the upper-right corner of the Expression section. From the menu, choose Component 1 (comp1)>Hydrogen Fuel Cell>fc.IsMag - Electrode current density magnitude - A/m².
3
Click to expand the Range section. Select the Manual color range check box.
4
In the Maximum text field, type 1e4.
Arrow Surface 1
1
In the Model Builder window, right-click GDL Current Density Distribution and choose Arrow Surface.
2
In the Settings window for Arrow Surface, click Replace Expression in the upper-right corner of the Expression section. From the menu, choose Component 1 (comp1)>Hydrogen Fuel Cell>fc.Isx,fc.Isy - Electrode current density vector.
3
In the GDL Current Density Distribution toolbar, click  Plot.
4
Click the  Zoom Extents button in the Graphics toolbar.
Anode Reaction Current Density
1
In the Home toolbar, click  Add Plot Group and choose 1D Plot Group.
2
In the Settings window for 1D Plot Group, type Anode Reaction Current Density in the Label text field.
Line Graph 1
1
Right-click Anode Reaction Current Density and choose Line Graph.
2
In the Settings window for Line Graph, locate the Selection section.
3
From the Selection list, choose Anode GDE.
4
Click Replace Expression in the upper-right corner of the y-Axis Data section. From the menu, choose Component 1 (comp1)>Definitions>Variables>i_a - Anode current density - A/m².
5
Locate the y-Axis Data section. In the Expression text field, type i_a*Av*l_act.
6
Select the Description check box.
7
In the associated text field, type Anode reaction current density.
8
Click Replace Expression in the upper-right corner of the x-Axis Data section. From the menu, choose Component 1 (comp1)>Geometry>Coordinate>y - y-coordinate.
9
In the Anode Reaction Current Density toolbar, click  Plot.
10
Click the  Zoom Extents button in the Graphics toolbar.
Velocity Field
1
In the Home toolbar, click  Add Plot Group and choose 2D Plot Group.
2
In the Settings window for 2D Plot Group, type Velocity Field in the Label text field.
Surface 1
1
Right-click Velocity Field and choose Surface.
2
In the Settings window for Surface, click Replace Expression in the upper-right corner of the Expression section. From the menu, choose Component 1 (comp1)>Hydrogen Fuel Cell>fc.U - Velocity magnitude - m/s.
Arrow Surface 1
1
In the Model Builder window, right-click Velocity Field and choose Arrow Surface.
2
In the Settings window for Arrow Surface, click Replace Expression in the upper-right corner of the Expression section. From the menu, choose Component 1 (comp1)>Hydrogen Fuel Cell>fc.u,fc.v - Velocity field.
3
In the Velocity Field toolbar, click  Plot.
4
Click the  Zoom Extents button in the Graphics toolbar.
Reactant Mass Fraction
1
In the Home toolbar, click  Add Plot Group and choose 2D Plot Group.
2
In the Settings window for 2D Plot Group, type Reactant Mass Fraction in the Label text field.
Surface 1
1
Right-click Reactant Mass Fraction and choose Surface.
2
In the Settings window for Surface, locate the Expression section.
3
In the Expression text field, type wReact.
Contour 1
1
In the Model Builder window, right-click Reactant Mass Fraction and choose Contour.
2
In the Settings window for Contour, locate the Expression section.
3
In the Expression text field, type wReact.
4
Locate the Coloring and Style section. From the Color table list, choose Thermal.
5
Clear the Color legend check box.
Arrow Surface 1
1
Right-click Reactant Mass Fraction and choose Arrow Surface.
2
In the Settings window for Arrow Surface, click Replace Expression in the upper-right corner of the Expression section. From the menu, choose Component 1 (comp1)>Hydrogen Fuel Cell>fc.u,fc.v - Velocity field.
3
In the Reactant Mass Fraction toolbar, click  Plot.
4
Click the  Zoom Extents button in the Graphics toolbar.
Water Mass Fraction
1
In the Home toolbar, click  Add Plot Group and choose 2D Plot Group.
2
In the Settings window for 2D Plot Group, type Water Mass Fraction in the Label text field.
Surface 1
1
Right-click Water Mass Fraction and choose Surface.
2
In the Settings window for Surface, locate the Expression section.
3
In the Expression text field, type fc.wH2O_H2.
Contour 1
1
In the Model Builder window, right-click Water Mass Fraction and choose Contour.
2
In the Settings window for Contour, locate the Expression section.
3
In the Expression text field, type fc.wH2O_O2.
4
In the Water Mass Fraction toolbar, click  Plot.
5
Click the  Zoom Extents button in the Graphics toolbar.