PDF

Piezoelectric Tonpilz Transducer with a Prestressed Bolt
Introduction
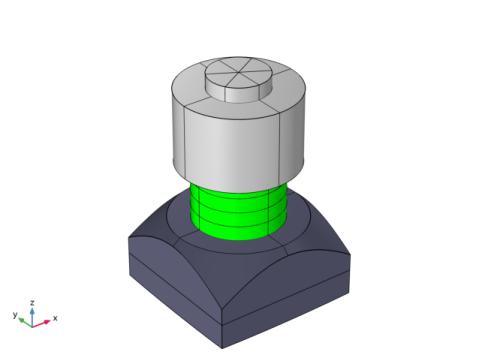
A tonpilz transducer, such as the one shown in Figure 1, is used for relatively low frequency, high power sound emission. It is one of the popular transducer configurations for sonar applications. The transducer consists of piezoceramic rings stacked between a head mass and a tail mass which are connected by a central bolt. This example shows how to incorporate the effect of a pretension in the bolt for various levels of bolt preload. A constitutive model is set up in order to incorporate the prestress effects on the piezoelectric material of the rings. The bolt geometry is imported from the Part Libraries. The frequency response of the transducer is studied to determine structural and acoustic response of the device such as deformation, stresses, radiated power, sound pressure level, the transmitting voltage response (TVR) curve, and the directivity index (DI) of the sound beam.
Figure 1: A tonpilz transducer. The aluminum head mass is shown in dark gray, the central steel bolt and steel tail mass are shown in light gray and the piezostack actuator with four disks of PZT-4 is shown in green.
Note: This application requires both the Acoustics Module and the Structural Mechanics Module.
A similar version of this tutorial entitled Piezoelectric Tonpilz Transducer, is available in the Application Libraries under Acoustics Module only. That version of the tutorial analyzes a slightly different geometry and does not implement the pretension in the bolt and hence does not require the Structural Mechanics Module. For additional details related to different customized settings and user-defined variables used in both the tonpilz transducer models, you are encouraged to read the documentation of the Piezoelectric Tonpilz Transducer tutorial.
Model Definition
The basic working principle involved in the operation of this transducer is that an AC electrical signal applied to the piezostack actuator produces vibration in the entire transducer which in turn produces sound waves in the surrounding fluid. Thus modeling the operation of the transducer requires coupling electrical, structural and acoustic phenomena.
In this tutorial we will particularly emphasize on the implementation of pretension in the central bolt of the transducer and associated solver settings that allow us to model the effect of prestress on the frequency response characteristics of the transducer.
The parameters used in this model are shown in Table 1.
physics implementation
The Pressure Acoustics, Boundary Elements physics is used to solve for the wave equation in the water domain. The Solid Mechanics physics is solved on all structural materials including the PZT-4 disks. The Electrostatics physics is solved on the PZT-4 disks. The multiphysics couplings necessary to model this system are available as predefined nodes under the Multiphysics node. These couplings are:
Acoustic-Structure Boundary: This node is active on the boundaries that are at the interface of the water domain and transducer head mass. On these boundaries a bidirectional coupling is automatically set up. The fluid pressure evaluated by the Pressure Acoustics, Boundary Elements physics is applied as a mechanical load in the Solid Mechanics physics. Furthermore, the normal component of the structural acceleration is used as a sound source.
Piezoelectric Effect: This node is active on the PZT-4 domains only and couple the Solid Mechanics and Electrostatics equations solved in these domains via the linear constitutive equations that model the piezoelectric effect by coupling stresses and strains with electric field and electric displacement.
boundary settings
The outer curved surface of the steel tail mass has a Spring Foundation condition applied, with a total spring constant of 10000[N/m]. This means that the transducer is effectively on a free condition in its operation range, as the spring foundation leaves the translational modes below 100 [Hz]. Each of the piezo disks are excited with a 1 V RMS electrical signal.
The head mass is exposed to a semi-infinite region of water represented by the Pressure Acoustics, Boundary Elements physics. Losses in the fluid domain are included using the built-in Ocean Attenuation available.
The Pressure Acoustics, Boundary Elements physics allows computation of both amplitude and phase of the acoustic pressure and sound pressure level (SPL) at any point in the semi-infinite space. This pressure is used to compute the TVR and DI.
The user-defined variables used to compute the transducer characteristics are shown in Table 2.
Modeling a Bolt with Pretension
When a bolt is mounted on a device to clamp the components, it is tightened by twisting the bolt head. As a reaction to the tightening process, a pretension force is experienced by the bolt. This force produces a prestress that helps to hold the bolt in place during regular operation of the device. This also ensures that when additional stresses develop in the bolt during operation of the device, it should not become loose. Note that the tightening of the bolt also produces stresses in the surrounding components, including the piezoelectric material. This is why accounting for the pretension force in the bolt would give us an accurate picture of the prestress distribution not only in the bolt but also in the entire device.
The piezoelectric properties are usually altered when the material is stressed, varying the value of some of the piezoelectric constants as the stress value changes. For this purpose a constitutive model is used. The form of the model is based on experimental results. This model uses an approach similar to the one described in Ref. 1, where the piezoelectric constants of the material depend on the nominal pretension stress at the piezoelectric material, as defined in Equation 1.
(1)
In Equation 1 σpzt is the nominal pretension stress at the piezoelectric material, Fpre is the Bolt pre-stress force and Apzt is the area of the piezoelectric material perpendicular to the bolt axis.
.
Figure 2: Variation of the piezoelectric constants as a function of the nominal pretension stress. The values are normalized at a pretension stress of 50 MPa.
Figure 2 shows the variation of the piezoelectric properties of the material as a function of the nominal pretension stress of the piezoelectric material. The values shown in this curve are generic and included in the model as an example.
COMSOL’s Structural Mechanics Module provides a Bolt Pretension feature that can be used to implement a desired pretension or prestress in bolted joints. You can import the bolt geometry from the Part Libraries. These bolt geometries are created in a certain way so that we can directly use the Bolt Pretension feature on them. In order to use this feature, there should be a cross section surface passing through the shank of the bolt. This surface needs to be associated with the Bolt Selection subnode under the Bolt Pretension node. COMSOL sets up an additional equation for each bolt that computes the pre-deformation of the bolt, the pretension force as well as the shear force in the bolt. For example, in this model, on application of 3.1 kN pretension, we get a pre-deformation of 37 μm.
Note that the deformation along the longitudinal axis of the bolt is discontinuous at the surface assigned to the Bolt Selection subnode but the stresses and strains are continuous. For more details on implementation of the Bolt Pretension feature, you can refer to the section on Pretensioned Bolts in the Structural Mechanics Module User’s Guide.
As a result of the prestress in the device, if we want to solve a vibrations problem in frequency domain, we need to account for the fact that the harmonic variation of stress and other physical quantities during vibration takes place on top of the static bias stress. Hence we need to solve this model using a two-step approach where the first step involves solving for the static stress distribution using a Stationary study step. The solution from this step is then used as a linearization point for solving the vibration problem in the Frequency Domain Perturbation study step.
Note that this workflow is valid only for small perturbations about the static solution. Hence we should only use this technique if the magnitude of the stress and other physical quantities from the frequency domain problem is significantly smaller than the magnitude of the same quantities obtained from the static problem.
The AC voltage signal applied to the piezostack actuator is specified using the linper() operator. This operator ensures that the numerical input is used only in the Frequency Domain Perturbation step and not in the Stationary step when solving the model. Furthermore, when solving the vibrations problem in frequency domain, you only want to account for the stress generated in the device as a result of its operation and hence you do not want to solve the pre-deformation variable in the bolt. This is ensured by using the Frequency Domain Perturbation study step.
Results and Discussion
Figure 3: Static z-component of the stress in the transducer for two levels of pretension. An exaggerated deformation has been used for better visualization.
Figure 3 shows the z-component of the static stress in the transducer for two levels of bolt pretension. The stress is fairly uniform in the shank of the bolt. Note that the largest stress appears mainly in the shank of the bolt and in the central part of the aluminum head mass which is located directly below the bolt.
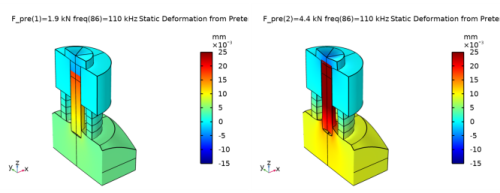
Figure 4: Static displacement of the transducer for different levels of pretension. An exaggerated deformation has been used for better visualization.
Figure 4 shows the z-component of the static displacement in the transducer for three levels of bolt pretension. Note the discontinuity of displacements through the shank of the bolt and the small displacement around the tail mass due to the Spring Foundation boundary condition.
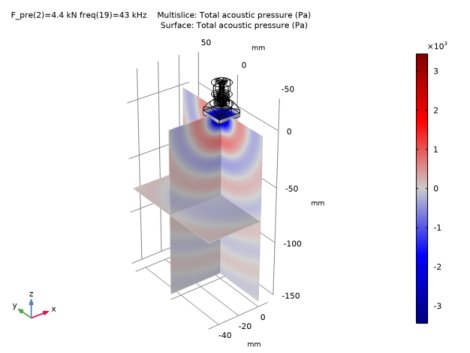
Figure 5: Slice plot of the total acoustic pressure in the water domain at 43 kHz for a pretension of 4.4 kN.
Figure 5 shows the total acoustic pressure in the water domain for 43 kHz excitation. Note that the transducer behaves mostly as an omni directional sound at this frequency.
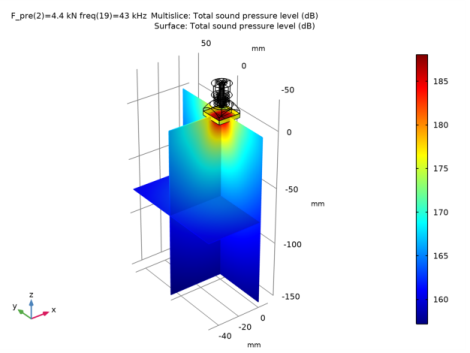
Figure 6: Slice plot showing the variation in sound pressure level (in dB) in the water domain at 43 kHz for a pretension of 4.4 kN.
Figure 5 shows the sound pressure level (SPL) in the water domain for 43 kHz excitation. The SPL is highest near the transducer head mass. The variation in the SPL around the transducer would depend on the operating frequency and the dominant mode in which the transducer vibrates.
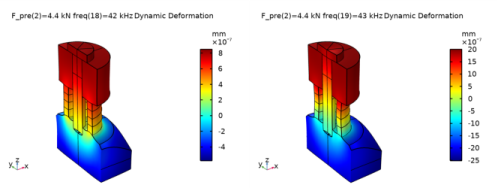
Figure 7: Variation in the dynamic displacement of the transducer between 42 kHz and 43 kHz for a pretension of 4.4 kN.
Figure 7 shows the dynamic deformation and vertical displacement of the tonpilz transducer at 43 kHz and 44 kHz excitation. The sudden change in the deformed shape for these two close frequencies indicates a structural mode. The head mass vibrates mainly along its axis similar to a flanged piston.
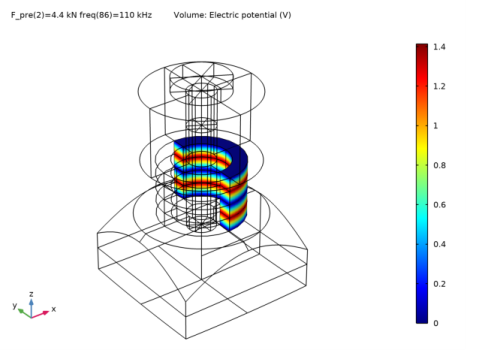
Figure 8: Electric potential distribution within the four PZT-4 disks.
Figure 8 shows the electric potential distribution through the thickness of the PZT-4 disks. The piezoelectric disks are stacked in a way such that alternate disks are poled along opposite directions. This allows us to use a single electrical terminal at the interface of each pair of disks and obtain the piezoelectric actuation effect in each of the disks along the same direction. Having the piezoelectric strain in-phase in all the disks maximizes the actuation.
In this model, the PZT-4 disks actuate in the d33-mode. Hence two of the disks are poled along the +Z direction while the other two are poled along the Z direction. The default definition of the piezoelectric material properties in COMSOL’s Global Coordinate System automatically creates a +Z polarization. In order to create a Z polarization, a user-defined Rotated Coordinate System is used. In this coordinate system, the Euler angles are set to α = 0, β = π and γ = 0.
Figure 9: Frequency response plot of the absolute value, real and imaginary components of the specific acoustic impedance at the interface between the head mass and water for a pretension of 3.1 kN.
Figure 9 shows the frequency response of the specific acoustic impedance of the head mass surface that is exposed to water.
Figure 10: Transmitting Voltage Response (TVR) as a function of frequency obtained at an on-axis distance of 1 m ahead of the head mass and computed relative to 1 μPa/V for two levels of bolt pretension.
Figure 10 shows the variation in the TVR of the transducer as a function of operating frequency. The fairly flat region above 30 kHz can be particularly useful for sensing applications.
Figure 11: Frequency response of the Directivity Index (DI) computed at an on-axis distance of 500 m from the head mass.
Figure 11 shows the Directivity Index (DI) of the tonpilz transducer (blue curve) and compares it with the DI of a flanged piston (green curve). The latter can be computed from analytical expression as shown in Table 2. It is defined by the variable DI_fl_pist. Note that the DI is very similar to that of a flanged piston for most of the frequency range.
Figure 12: Total radiated power from the tonpilz transducer within the operating frequency range of 1 kHz to 110 kHz for the two levels of bolt pretension.
Figure 12 shows the total radiated power as a function of the operating frequency of the tonpilz transducer. Note that the modification of the piezoelectric properties with the pretension is reflected in the frequency at which the maximum power is produced and also in the shape of the curve.
Figure 13: Absolute electric impedance and its angle for the two levels of bolt pretension.
Figure 13 shows the absolute electric impedance and its angle for the two levels of bolt pretension. The two main resonances are quite clear due to the sudden change of the electric impedance angle.
References
1. Bo Fu ; Ting Li ; Yongle Xie, Model-Based Diagnosis for Pre-Stress of Langevin Transducers” IEEE Circuits and Systems International Conference on Testing and Diagnosis, 2009.
Application Library path: Acoustics_Module/Piezoelectric_Devices/tonpilz_transducer_prestressed
Modeling Instructions
From the File menu, choose New.
New
In the New window, click  Model Wizard.
Model Wizard
1
In the Model Wizard window, click  3D.
2
In the Select Physics tree, select Acoustics>Pressure Acoustics>Pressure Acoustics, Boundary Elements (pabe).
3
Click Add.
4
In the Select Physics tree, select Structural Mechanics>Electromagnetics-Structure Interaction>Piezoelectricity>Piezoelectricity, Solid.
5
Click Add.
6
Click  Study.
7
In the Select Study tree, select Preset Studies for Some Physics Interfaces>Bolt Pretension.
8
Geometry 1
1
In the Model Builder window, under Component 1 (comp1) click Geometry 1.
2
In the Settings window for Geometry, locate the Units section.
3
From the Length unit list, choose mm.
Import the file containing the model parameters.
Global Definitions
Parameters 1
1
In the Model Builder window, under Global Definitions click Parameters 1.
2
In the Settings window for Parameters, locate the Parameters section.
3
Click  Load from File.
4
Geometry 1
Work Plane 1 (wp1)
1
In the Geometry toolbar, click  Work Plane.
The modeling geometry is created by first drawing the cross section on a work plane and then revolving this cross section to get the 3-dimensional geometry. The central bolt in the transducer is later added from the Part Libraries.
2
In the Settings window for Work Plane, locate the Plane Definition section.
3
From the Plane list, choose xz-plane.
4
Click  Show Work Plane.
Work Plane 1 (wp1)>Rectangle 1 (r1)
1
In the Work Plane toolbar, click  Rectangle.
2
In the Settings window for Rectangle, locate the Size and Shape section.
3
In the Width text field, type 6[mm].
4
In the Height text field, type 10[mm].
5
Locate the Position section. In the xw text field, type 2[mm].
6
In the yw text field, type 15[mm].
Work Plane 1 (wp1)>Rectangle 2 (r2)
1
In the Work Plane toolbar, click  Rectangle.
2
In the Settings window for Rectangle, locate the Size and Shape section.
3
In the Width text field, type 2[mm].
4
In the Height text field, type 8[mm].
5
Locate the Position section. In the xw text field, type 4[mm].
6
In the yw text field, type 7[mm].
7
Click to expand the Layers section. In the table, enter the following settings:
Work Plane 1 (wp1)>Polygon 1 (pol1)
1
In the Work Plane toolbar, click  Polygon.
2
In the Settings window for Polygon, locate the Coordinates section.
3
Work Plane 1 (wp1)>Quadratic Bézier 1 (qb1)
1
In the Work Plane toolbar, click  More Primitives and choose Quadratic Bézier.
2
In the Settings window for Quadratic Bézier, locate the Control Points section.
3
In row 1, set xw to -20[mm].
4
In row 1, set yw to -3[mm].
5
In row 2, set yw to -5[mm].
6
In row 3, set xw to 20[mm].
7
In row 3, set yw to -3[mm].
Work Plane 1 (wp1)>Union 1 (uni1)
1
In the Work Plane toolbar, click  Booleans and Partitions and choose Union.
2
Select the objects pol1 and qb1 only.
Work Plane 1 (wp1)>Delete Entities 1 (del1)
1
In the Model Builder window, right-click Plane Geometry and choose Delete Entities.
2
On the object uni1, select Boundaries 1, 2, and 8 only.
3
In the Settings window for Delete Entities, click  Build Selected.
Revolve 1 (rev1)
In the Model Builder window, under Component 1 (comp1)>Geometry 1 right-click Work Plane 1 (wp1) and choose Revolve.
Block 1 (blk1)
1
In the Geometry toolbar, click  Block.
2
In the Settings window for Block, locate the Size and Shape section.
3
In the Width text field, type 20[mm].
4
In the Depth text field, type 20[mm].
5
In the Height text field, type 60[mm].
6
Locate the Position section. From the Base list, choose Center.
7
Click to expand the Layers section. In the table, enter the following settings:
Intersection 1 (int1)
1
In the Geometry toolbar, click  Booleans and Partitions and choose Intersection.
2
Click in the Graphics window and then press Ctrl+A to select both objects.
3
In the Settings window for Intersection, click  Build Selected.
Create domain and boundary selections that will be used in the model.
Aluminum
1
In the Geometry toolbar, click  Selections and choose Explicit Selection.
2
In the Settings window for Explicit Selection, type Aluminum in the Label text field.
3
On the object int1, select Domains 1 and 2 only.
Steel Part
1
In the Geometry toolbar, click  Selections and choose Explicit Selection.
2
In the Settings window for Explicit Selection, type Steel Part in the Label text field.
3
On the object int1, select Domain 3 only.
4
Locate the Resulting Selection section. Clear the Keep selection check box.
5
Find the Cumulative selection subsection. Click New.
6
In the New Cumulative Selection dialog box, type Steel in the Name text field.
7
+Z poled Piezo
1
In the Geometry toolbar, click  Selections and choose Explicit Selection.
2
In the Settings window for Explicit Selection, type +Z poled Piezo in the Label text field.
3
On the object int1, select Domains 4 and 6 only.
The selection should look like this.
-Z poled Piezo
1
In the Geometry toolbar, click  Selections and choose Explicit Selection.
2
In the Settings window for Explicit Selection, type -Z poled Piezo in the Label text field.
3
On the object int1, select Domains 5 and 7 only.
Ground boundaries
1
In the Geometry toolbar, click  Selections and choose Explicit Selection.
2
In the Settings window for Explicit Selection, type Ground boundaries in the Label text field.
3
Locate the Entities to Select section. From the Geometric entity level list, choose Boundary.
4
Click the  Wireframe Rendering button in the Graphics toolbar.
5
On the object int1, select Boundaries 22, 23, 30, 31, 36, 37, 63, 67, 70, 90, 94, and 97 only.
The selection should look like this.
Voltage boundaries
1
In the Geometry toolbar, click  Selections and choose Explicit Selection.
2
In the Settings window for Explicit Selection, type Voltage boundaries in the Label text field.
3
Locate the Entities to Select section. From the Geometric entity level list, choose Boundary.
4
On the object int1, select Boundaries 26, 27, 34, 35, 65, 69, 92, and 96 only.
Submerged boundaries
1
In the Geometry toolbar, click  Selections and choose Explicit Selection.
2
In the Settings window for Explicit Selection, type Submerged boundaries in the Label text field.
3
Locate the Entities to Select section. From the Geometric entity level list, choose Boundary.
4
On the object int1, select Boundaries 1–3, 8, 10, 56, 81, 111, and 113 only.
Spring foundation boundaries
1
In the Geometry toolbar, click  Selections and choose Explicit Selection.
2
In the Settings window for Explicit Selection, type Spring foundation boundaries in the Label text field.
3
Locate the Entities to Select section. From the Geometric entity level list, choose Boundary.
4
On the object int1, select Boundaries 14, 15, 59, and 104 only.
Piezo Domains
1
In the Geometry toolbar, click  Selections and choose Explicit Selection.
2
In the Settings window for Explicit Selection, type Piezo Domains in the Label text field.
3
On the object int1, select Domains 4–7 only.
The CAD geometry of a simple bolt with no thread is imported from the Part Libraries. The design parameters of the bolt are adjusted to position the bolt in the tonpilz transducer.
Part Libraries
1
In the Geometry toolbar, click  Parts and choose Part Libraries.
2
In the Part Libraries window, select Structural Mechanics Module>Bolts>simple_bolt_no_thread in the tree.
3
Click  Add to Geometry.
Geometry 1
Simple Bolt, No Thread 1 (pi1)
1
In the Model Builder window, under Component 1 (comp1)>Geometry 1 click Simple Bolt, No Thread 1 (pi1).
2
In the Settings window for Part Instance, locate the Input Parameters section.
3
4
Locate the Position and Orientation of Output section. Find the Coordinate system in part subsection. From the Work plane in part list, choose Head inner plane (wp1).
5
Find the Displacement subsection. In the zw text field, type 25.
6
Click to expand the Domain Selections section. In the table, enter the following settings:
7
Click to expand the Boundary Selections section. In the table, enter the following settings:
8
Click  Build Selected.
The geometry finalization method is changed to Form an Assembly to ensure that the bolt is not glued or rigidly attached to the adjacent parts.
Excluded BEM boundaries
1
In the Geometry toolbar, click  Selections and choose Complement Selection.
2
In the Settings window for Complement Selection, type Excluded BEM boundaries in the Label text field.
3
Locate the Geometric Entity Level section. From the Level list, choose Boundary.
4
Locate the Input Entities section. Click  Add.
5
In the Add dialog box, select Submerged boundaries in the Selections to invert list.
6
Form Union (fin)
1
In the Model Builder window, under Component 1 (comp1)>Geometry 1 click Form Union (fin).
2
In the Settings window for Form Union/Assembly, locate the Form Union/Assembly section.
3
From the Action list, choose Form an assembly.
4
Select the Create imprints check box.
5
In the Geometry toolbar, click  Build All.
An Identity Pair is used to get continuity in solution between the external surfaces of the bolt and the surfaces of other materials touching them. This continuity in solution is applicable for the lower end of the shank that is bolted into the aluminum head mass and the lower surface of the bolt head which is resting on the steel tail mass. The outer surface of the shank should be allowed to slip through the hole in the tail mass. Hence those boundaries need to be removed from the Identity Pair by modifying the default Identity Pair that has been created.
Source Boundaries
1
In the Geometry toolbar, click  Selections and choose Explicit Selection.
2
In the Settings window for Explicit Selection, type Source Boundaries in the Label text field.
3
Locate the Entities to Select section. From the Geometric entity level list, choose Boundary.
4
On the object fin, select Boundaries 144, 145, 148, 153, 155, 156, 166, 176, 186, 189, 215, 219, 221, 225, 226, and 229 only.
Destination Boundaries
1
In the Geometry toolbar, click  Selections and choose Explicit Selection.
2
In the Settings window for Explicit Selection, type Destination Boundaries in the Label text field.
3
Locate the Entities to Select section. From the Geometric entity level list, choose Boundary.
4
On the object fin, select Boundaries 50–55, 62, 66, 91, 92, 102, 107, 126, 129, 130, and 133 only.
Definitions
Identity Boundary Pair 1 (ap1)
1
In the Model Builder window, under Component 1 (comp1)>Definitions click Identity Boundary Pair 1 (ap1).
2
In the Settings window for Pair, locate the Pair Type section.
3
Select the Manual control of selections and pair type check box.
4
Locate the Source Boundaries section. From the Selection list, choose Source Boundaries.
5
Locate the Destination Boundaries section. From the Selection list, choose Destination Boundaries.
Integration 1 (intop1)
1
In the Definitions toolbar, click  Nonlocal Couplings and choose Integration.
Define a nonlocal integration coupling on the acoustic-structure interface.
2
In the Settings window for Integration, locate the Source Selection section.
3
From the Geometric entity level list, choose Boundary.
4
From the Selection list, choose Submerged boundaries.
Integration 2 (intop2)
1
In the Definitions toolbar, click  Nonlocal Couplings and choose Integration.
This integral is only used to compute the nominal stress of the piezoelectric material.
2
In the Settings window for Integration, locate the Source Selection section.
3
From the Geometric entity level list, choose Boundary.
4
Click  Paste Selection.
5
In the Paste Selection dialog box, type 36 37 84 116 in the Selection text field.
6
Integration 3 (intop3)
1
In the Definitions toolbar, click  Nonlocal Couplings and choose Integration.
This integral is used to compute the equivalent area of a flanged piston
2
In the Settings window for Integration, locate the Source Selection section.
3
From the Geometric entity level list, choose Boundary.
4
Click  Paste Selection.
5
In the Paste Selection dialog box, type 6 in the Selection text field.
6
Proceed to define the relationship between the different properties of the piezoelectric material and the nominal stress.
c33 factor
1
In the Definitions toolbar, click  Interpolation.
2
In the Settings window for Interpolation, type c33 factor in the Label text field.
3
Locate the Definition section. In the Function name text field, type c33_factor.
4
5
Locate the Interpolation and Extrapolation section. From the Interpolation list, choose Piecewise cubic.
6
Locate the Units section. In the Arguments text field, type MPa.
7
In the Function text field, type 1.
Loss factor
1
In the Definitions toolbar, click  Interpolation.
2
In the Settings window for Interpolation, type Loss factor in the Label text field.
3
Locate the Definition section. In the Function name text field, type loss_factor.
4
5
Locate the Interpolation and Extrapolation section. From the Interpolation list, choose Piecewise cubic.
6
Locate the Units section. In the Arguments text field, type MPa.
7
In the Function text field, type 1.
d33 factor
1
In the Definitions toolbar, click  Interpolation.
2
In the Settings window for Interpolation, type d33 factor in the Label text field.
3
Locate the Definition section. In the Function name text field, type d33_factor.
4
5
Locate the Interpolation and Extrapolation section. From the Interpolation list, choose Piecewise cubic.
6
Locate the Units section. In the Arguments text field, type MPa.
7
In the Function text field, type 1.
Variables 1
1
In the Definitions toolbar, click  Local Variables.
Import the file containing the variable definitions. These variables will mainly be used for postprocessing calculations.
2
In the Settings window for Variables, locate the Variables section.
3
Click  Load from File.
4
Add Material
1
In the Home toolbar, click  Add Material to open the Add Material window.
2
Go to the Add Material window.
3
In the tree, select Built-in>Water, liquid.
4
Click  Add to Component 1 (comp1).
5
In the tree, select Built-in>Aluminum.
6
Click  Add to Component 1 (comp1).
7
In the tree, select Built-in>Steel AISI 4340.
8
Click  Add to Component 1 (comp1).
9
In the tree, select Piezoelectric>Lead Zirconate Titanate (PZT-4).
10
Click  Add to Component 1 (comp1).
11
In the Home toolbar, click  Add Material to close the Add Material window.
Materials
Water, liquid (mat1)
1
In the Settings window for Material, locate the Geometric Entity Selection section.
2
From the Selection list, choose All voids.
Aluminum (mat2)
1
In the Model Builder window, click Aluminum (mat2).
2
In the Settings window for Material, locate the Geometric Entity Selection section.
3
From the Selection list, choose Aluminum.
Steel AISI 4340 (mat3)
1
In the Model Builder window, click Steel AISI 4340 (mat3).
2
In the Settings window for Material, locate the Geometric Entity Selection section.
3
From the Selection list, choose Steel.
Lead Zirconate Titanate (PZT-4) (mat4)
1
In the Model Builder window, click Lead Zirconate Titanate (PZT-4) (mat4).
2
In the Settings window for Material, locate the Geometric Entity Selection section.
3
From the Selection list, choose Piezo Domains.
Pressure Acoustics, Boundary Elements (pabe)
1
In the Model Builder window, under Component 1 (comp1) click Pressure Acoustics, Boundary Elements (pabe).
2
In the Settings window for Pressure Acoustics, Boundary Elements, locate the Domain Selection section.
3
From the Selection list, choose All voids.
4
Locate the Sound Pressure Level Settings section. From the Reference pressure for the sound pressure level list, choose Use reference pressure for water.
5
Click to expand the Symmetry/Infinite Boundary Condition section. From the Condition for the z = z^0 plane list, choose Symmetric/Infinite sound hard boundary.
Excluded Boundary 1
1
In the Physics toolbar, click  Boundaries and choose Excluded Boundary.
2
In the Settings window for Excluded Boundary, locate the Boundary Selection section.
3
From the Selection list, choose Excluded BEM boundaries.
Pressure Acoustics 1
1
In the Model Builder window, click Pressure Acoustics 1.
2
In the Settings window for Pressure Acoustics, locate the Pressure Acoustics Model section.
3
From the Fluid model list, choose Ocean attenuation.
4
Locate the Model Input section. In the D text field, type w_depth.
Solid Mechanics (solid)
Piezoelectric Material 1
1
In the Model Builder window, under Component 1 (comp1)>Solid Mechanics (solid) click Piezoelectric Material 1.
2
In the Settings window for Piezoelectric Material, locate the Domain Selection section.
3
From the Selection list, choose +Z poled Piezo.
Mechanical Damping 1
In the Physics toolbar, click  Attributes and choose Mechanical Damping.
Piezoelectric Material 2
1
Right-click Piezoelectric Material 1 and choose Duplicate.
2
In the Settings window for Piezoelectric Material, locate the Domain Selection section.
3
From the Selection list, choose -Z poled Piezo.
Define a rotated system that will be used for the poling of the -Z poled piezoelectric disks.
Definitions
Rotated System 2 (sys2)
1
In the Definitions toolbar, click  Coordinate Systems and choose Rotated System.
2
In the Settings window for Rotated System, locate the Rotation section.
3
Find the Euler angles (Z-X-Z) subsection. In the β text field, type pi.
Solid Mechanics (solid)
Piezoelectric Material 2
1
In the Model Builder window, under Component 1 (comp1)>Solid Mechanics (solid) click Piezoelectric Material 2.
2
In the Settings window for Piezoelectric Material, locate the Coordinate System Selection section.
3
From the Coordinate system list, choose Rotated System 2 (sys2).
Spring Foundation 1
1
In the Physics toolbar, click  Boundaries and choose Spring Foundation.
2
In the Settings window for Spring Foundation, locate the Boundary Selection section.
3
From the Selection list, choose Spring foundation boundaries.
4
Locate the Spring section. From the Spring type list, choose Total spring constant.
5
In the ktot text field, type 10000[N/m].
Bolt Pretension 1
1
In the Physics toolbar, click  Global and choose Bolt Pretension.
2
In the Settings window for Bolt Pretension, locate the Bolt Pretension section.
3
In the Fp text field, type F_pre.
Bolt Selection 1
1
In the Model Builder window, expand the Bolt Pretension 1 node, then click Bolt Selection 1.
2
In the Settings window for Bolt Selection, locate the Boundary Selection section.
3
From the Selection list, choose Pretension cut (Simple Bolt, No Thread 1).
Continuity 1
1
In the Physics toolbar, click  Pairs and choose Continuity.
2
In the Settings window for Continuity, locate the Pair Selection section.
3
Under Pairs, click  Add.
4
In the Add dialog box, select Identity Boundary Pair 1 (ap1) in the Pairs list.
5
Linear Elastic Material 1
In the Model Builder window, click Linear Elastic Material 1.
Damping 1
1
In the Physics toolbar, click  Attributes and choose Damping.
2
In the Settings window for Damping, locate the Damping Settings section.
3
From the Input parameters list, choose Damping ratios.
4
In the f1 text field, type f0min.
5
In the ζ1 text field, type eta_struct.
6
In the f2 text field, type f0max.
7
In the ζ2 text field, type eta_struct.
Electrostatics (es)
1
In the Model Builder window, under Component 1 (comp1) click Electrostatics (es).
2
In the Settings window for Electrostatics, locate the Domain Selection section.
3
From the Selection list, choose Piezo Domains.
Ground 1
1
In the Physics toolbar, click  Boundaries and choose Ground.
2
In the Settings window for Ground, locate the Boundary Selection section.
3
From the Selection list, choose Ground boundaries.
Terminal 1
1
In the Physics toolbar, click  Boundaries and choose Terminal.
2
In the Settings window for Terminal, locate the Boundary Selection section.
3
From the Selection list, choose Voltage boundaries.
4
Locate the Terminal section. From the Terminal type list, choose Voltage.
5
In the V0 text field, type linper(V0).
The linper() operator ensures that the voltage V0 is only applied in the frequency domain perturbation study step and not during the stationary analysis. If you have the AC/DC Module you can right click and add the Harmonic Perturbation sub-feature, which will do the same.
Add the multiphysics feature between the acoustic and the structural domains.
Multiphysics
Acoustic-Structure Boundary 1 (asb1)
1
In the Physics toolbar, click  Multiphysics Couplings and choose Boundary>Acoustic-Structure Boundary.
2
In the Settings window for Acoustic-Structure Boundary, locate the Boundary Selection section.
3
From the Selection list, choose Submerged boundaries.
Modify the piezoelectric material to account for the variation of properties-
Materials
Lead Zirconate Titanate (PZT-4) (with constitutive model)
1
In the Model Builder window, under Component 1 (comp1)>Materials click Lead Zirconate Titanate (PZT-4) (mat4).
2
In the Settings window for Material, type Lead Zirconate Titanate (PZT-4) (with constitutive model) in the Label text field.
3
Locate the Material Contents section. In the table, enter the following settings:
Mesh the geometry; create a tetrahedral mesh in the solid and the water-inner domains and create a swept mesh in the PML.
Mesh 1
Mapped 1
1
In the Mesh toolbar, click  Boundary and choose Mapped.
2
Size
1
In the Model Builder window, click Size.
2
In the Settings window for Size, locate the Element Size section.
3
Click the Custom button.
4
Locate the Element Size Parameters section. In the Maximum element size text field, type 6[mm].
5
In the Minimum element size text field, type 1[mm].
6
In the Curvature factor text field, type 0.3.
7
Click  Build All.
Swept 1
1
In the Mesh toolbar, click  Swept.
2
In the Settings window for Swept, locate the Domain Selection section.
3
From the Geometric entity level list, choose Domain.
4
Distribution 1
1
Right-click Swept 1 and choose Distribution.
2
In the Settings window for Distribution, locate the Domain Selection section.
3
From the Selection list, choose Piezo Domains.
4
Locate the Distribution section. In the Number of elements text field, type 2.
Free Tetrahedral 1
In the Mesh toolbar, click  Free Tetrahedral.
Size 1
1
Right-click Free Tetrahedral 1 and choose Size.
Apply a mesh setting on the Destination boundaries of the Identity Pair such that the mesh on these surfaces is somewhat finer than the mesh on the Source boundaries of the Identity Pair.
2
In the Settings window for Size, locate the Geometric Entity Selection section.
3
From the Geometric entity level list, choose Boundary.
4
From the Selection list, choose Ground boundaries.
5
Click  Build All.
Study 1
Frequency Domain Perturbation
1
In the Study toolbar, click  Study Steps and choose Frequency Domain>Frequency Domain Perturbation.
The Bolt Pretension step solves for the effect of pretension in the bolt. This is a stationary step and does not solve the Acoustics problem - this can be seen from the small orange exclamation marks next to the acoustics in the Physics and Variables Selection section. The Frequency-Domain Perturbation step solves all the physics including the induced effect of the pretension of the bolt.
2
In the Settings window for Frequency Domain Perturbation, locate the Study Settings section.
3
From the Frequency unit list, choose kHz.
4
In the Frequencies text field, type 1 2 5 10 20 range(f0min,f0step,f0max).
Make sure to select the Include geometric nonlinearity check box - if it is not selected the effect of the pretensioning will not be included as the linearization point for the frequency domain study.
5
Select the Include geometric nonlinearity check box.
Step 1: Bolt Pretension
1
In the Model Builder window, click Step 1: Bolt Pretension.
2
In the Settings window for Bolt Pretension, locate the Physics and Variables Selection section.
3
In the table, clear the Solve for check box for Pressure Acoustics, Boundary Elements (pabe).
4
In the table, clear the Solve for check box for Acoustic-Structure Boundary 1 (asb1).
Parametric Sweep
1
In the Study toolbar, click  Parametric Sweep.
2
In the Settings window for Parametric Sweep, locate the Study Settings section.
3
4
5
In the Model Builder window, click Study 1.
6
In the Settings window for Study, locate the Study Settings section.
7
Clear the Generate default plots check box.
Solution 1 (sol1)
1
In the Study toolbar, click  Show Default Solver.
2
In the Model Builder window, expand the Solution 1 (sol1) node.
3
In the Model Builder window, expand the Study 1>Solver Configurations>Solution 1 (sol1)>Stationary Solver 2 node.
4
Right-click Suggested Direct Solver (pze1_asb1) and choose Enable.
5
In the Study toolbar, click  Compute.
The following instructions describe how to create the plots shown in the Results section.
Results
Grid 3D 1
1
In the Model Builder window, expand the Results node.
2
Right-click Results>Datasets and choose More 3D Datasets>Grid 3D.
3
In the Settings window for Grid 3D, locate the Data section.
4
From the Dataset list, choose Study 1/Parametric Solutions 1 (sol3).
5
Locate the Parameter Bounds section. Find the First parameter subsection. In the Minimum text field, type -50[mm].
6
In the Maximum text field, type 0.
7
Find the Second parameter subsection. In the Minimum text field, type -50[mm].
8
In the Maximum text field, type 50[mm].
9
Find the Third parameter subsection. In the Maximum text field, type -150[mm].
10
Click to expand the Resolution section. In the x resolution text field, type 40.
11
In the y resolution text field, type 80.
12
In the z resolution text field, type 120.
13
Static Stress from Pretension
1
In the Results toolbar, click  3D Plot Group.
2
In the Settings window for 3D Plot Group, type Static Stress from Pretension in the Label text field.
3
Locate the Data section. From the Dataset list, choose Study 1/Parametric Solutions 1 (sol3).
4
Click to expand the Title section. From the Title type list, choose Label.
5
Locate the Plot Settings section. Clear the Plot dataset edges check box.
6
Locate the Color Legend section. Select the Show units check box.
Volume 1
1
Right-click Static Stress from Pretension and choose Volume.
2
In the Settings window for Volume, locate the Expression section.
3
In the Expression text field, type solid.sz.
4
From the Unit list, choose MPa.
5
From the Expression evaluated for list, choose Static solution.
6
Click to expand the Range section. Select the Manual color range check box.
7
In the Minimum text field, type -100.
8
In the Maximum text field, type 400.
Filter 1
1
Right-click Volume 1 and choose Filter.
2
In the Settings window for Filter, locate the Element Selection section.
3
In the Logical expression for inclusion text field, type x>-0.01[mm].
Deformation 1
1
In the Model Builder window, right-click Volume 1 and choose Deformation.
2
In the Settings window for Deformation, locate the Expression section.
3
From the Expression evaluated for list, choose Static solution.
4
Locate the Scale section. Select the Scale factor check box.
5
Line 1
1
In the Model Builder window, right-click Static Stress from Pretension and choose Line.
2
In the Settings window for Line, locate the Expression section.
3
In the Expression text field, type 0.
4
From the Expression evaluated for list, choose Static solution.
5
Click to expand the Title section. From the Title type list, choose None.
6
Locate the Coloring and Style section. From the Coloring list, choose Uniform.
7
From the Color list, choose Black.
8
Click to expand the Inherit Style section. From the Plot list, choose Volume 1.
9
Clear the Color check box.
10
Clear the Color and data range check box.
Deformation 1
In the Model Builder window, right-click Deformation 1 and choose Copy.
Deformation 1
In the Model Builder window, right-click Line 1 and choose Paste Deformation.
Filter 1
In the Model Builder window, right-click Filter 1 and choose Copy.
Filter 1
1
In the Model Builder window, right-click Line 1 and choose Paste Filter.
Now loop through the prestress force to reproduce the results on Figure 3.
Static Deformation from Pretension
1
In the Model Builder window, right-click Filter 1 and choose Duplicate.
2
In the Model Builder window, click Static Stress from Pretension 1.
3
In the Settings window for 3D Plot Group, type Static Deformation from Pretension in the Label text field.
Volume 1
1
In the Model Builder window, click Volume 1.
2
In the Settings window for Volume, locate the Expression section.
3
In the Expression text field, type w.
4
Locate the Range section. In the Minimum text field, type -0.015.
5
In the Maximum text field, type 0.025.
6
In the Static Deformation from Pretension toolbar, click  Plot.
Now loop through the prestress force to reproduce the results on Figure 4.
Acoustic Pressure
1
In the Home toolbar, click  Add Plot Group and choose 3D Plot Group.
2
In the Settings window for 3D Plot Group, type Acoustic Pressure in the Label text field.
3
Locate the Data section. From the Dataset list, choose Grid 3D 1.
4
From the Parameter value (freq (kHz)) list, choose 43.
5
Locate the Plot Settings section. Clear the Plot dataset edges check box.
Multislice 1
1
In the Acoustic Pressure toolbar, click  More Plots and choose Multislice.
2
In the Settings window for Multislice, locate the Multiplane Data section.
3
Find the x-planes subsection. From the Entry method list, choose Coordinates.
4
In the Coordinates text field, type 0.
5
Locate the Coloring and Style section. From the Color table list, choose Wave.
6
Select the Symmetrize color range check box.
7
In the Acoustic Pressure toolbar, click  Plot.
8
Click the  Zoom Extents button in the Graphics toolbar.
Line 1
1
In the Model Builder window, right-click Acoustic Pressure and choose Line.
2
In the Settings window for Line, locate the Data section.
3
From the Dataset list, choose Study 1/Parametric Solutions 1 (sol3).
4
From the Solution parameters list, choose From parent.
5
Locate the Expression section. In the Expression text field, type 0.
6
Locate the Title section. From the Title type list, choose None.
7
Locate the Coloring and Style section. From the Coloring list, choose Uniform.
8
From the Color list, choose Black.
9
In the Acoustic Pressure toolbar, click  Plot.
Surface 1
1
Right-click Acoustic Pressure and choose Surface.
2
In the Settings window for Surface, locate the Data section.
3
From the Dataset list, choose Study 1/Parametric Solutions 1 (sol3).
4
From the Solution parameters list, choose From parent.
5
Locate the Expression section. In the Expression text field, type pabe.p_t_bnd.
6
Click to expand the Inherit Style section. From the Plot list, choose Multislice 1.
7
In the Acoustic Pressure toolbar, click  Plot.
The plot should look like Figure 5.
Sound Pressure Level
1
Right-click Acoustic Pressure and choose Duplicate.
2
In the Settings window for 3D Plot Group, type Sound Pressure Level in the Label text field.
Multislice 1
1
In the Model Builder window, expand the Results>Sound Pressure Level node, then click Multislice 1.
2
In the Settings window for Multislice, locate the Expression section.
3
In the Expression text field, type pabe.Lp.
4
Locate the Coloring and Style section. From the Color table list, choose Rainbow.
5
Clear the Symmetrize color range check box.
6
In the Sound Pressure Level toolbar, click  Plot.
Surface 1
1
In the Model Builder window, click Surface 1.
2
In the Settings window for Surface, locate the Expression section.
3
In the Expression text field, type pabe.Lp_bnd.
4
In the Sound Pressure Level toolbar, click  Plot.
The plot should look like Figure 6.
Voltage
1
In the Home toolbar, click  Add Plot Group and choose 3D Plot Group.
2
In the Settings window for 3D Plot Group, type Voltage in the Label text field.
3
Locate the Data section. From the Dataset list, choose Study 1/Parametric Solutions 1 (sol3).
4
Click to expand the Selection section. From the Geometric entity level list, choose Domain.
5
From the Selection list, choose Piezo Domains.
Volume 1
1
Right-click Voltage and choose Volume.
2
In the Settings window for Volume, locate the Expression section.
3
In the Expression text field, type V.
Filter 1
1
Right-click Volume 1 and choose Filter.
2
In the Settings window for Filter, locate the Element Selection section.
3
In the Logical expression for inclusion text field, type x>-0.01[mm].
4
In the Voltage toolbar, click  Plot.
The plot should look like Figure 8.
Dynamic Deformation
1
In the Model Builder window, right-click Static Deformation from Pretension and choose Duplicate.
2
In the Model Builder window, click Static Deformation from Pretension 1.
3
In the Settings window for 3D Plot Group, type Dynamic Deformation in the Label text field.
Volume 1
1
In the Model Builder window, click Volume 1.
2
In the Settings window for Volume, locate the Expression section.
3
From the Expression evaluated for list, choose Harmonic perturbation.
4
Locate the Range section. Clear the Manual color range check box.
Deformation 1
1
In the Model Builder window, expand the Volume 1 node, then click Deformation 1.
2
In the Settings window for Deformation, locate the Expression section.
3
From the Expression evaluated for list, choose Harmonic perturbation.
4
Locate the Scale section. Clear the Scale factor check box.
Deformation 1
1
In the Model Builder window, expand the Results>Dynamic Deformation>Line 1 node, then click Deformation 1.
2
In the Settings window for Deformation, locate the Expression section.
3
From the Expression evaluated for list, choose Harmonic perturbation.
Loop through the frequencies to reproduce the results on Figure 7.
Specific Acoustic Impedance
1
In the Home toolbar, click  Add Plot Group and choose 1D Plot Group.
2
In the Settings window for 1D Plot Group, type Specific Acoustic Impedance in the Label text field.
3
Locate the Data section. From the Dataset list, choose Study 1/Parametric Solutions 1 (sol3).
4
From the Parameter selection (F_pre) list, choose From list.
5
In the Parameter values (F_pre (kN)) list, select 4.4.
6
Click to expand the Title section. From the Title type list, choose Label.
7
Locate the Plot Settings section. Select the x-axis label check box.
8
9
Select the y-axis label check box.
10
11
Locate the Legend section. From the Position list, choose Upper left.
Global 1
1
Right-click Specific Acoustic Impedance and choose Global.
2
In the Settings window for Global, locate the y-Axis Data section.
3
4
Click to expand the Legends section. From the Legends list, choose Manual.
5
6
Locate the x-Axis Data section. From the Parameter list, choose Expression.
7
In the Expression text field, type freq.
8
From the Unit list, choose kHz.
9
Click to expand the Coloring and Style section. In the Width text field, type 2.
10
Find the Line style subsection. From the Line list, choose Cycle.
11
In the Specific Acoustic Impedance toolbar, click  Plot.
The plot should look like Figure 9.
Transmitting Voltage Response (TVR)
1
In the Model Builder window, right-click Specific Acoustic Impedance and choose Duplicate.
2
In the Settings window for 1D Plot Group, type Transmitting Voltage Response (TVR) in the Label text field.
3
Locate the Data section. From the Parameter selection (F_pre) list, choose All.
4
Locate the Plot Settings section. In the y-axis label text field, type TVR (dB rel. 1\mu Pa/V).
5
Locate the Legend section. From the Position list, choose Lower right.
Global 1
1
In the Model Builder window, expand the Transmitting Voltage Response (TVR) node, then click Global 1.
2
In the Settings window for Global, click Replace Expression in the upper-right corner of the y-Axis Data section. From the menu, choose Component 1 (comp1)>Definitions>Variables>TVR - Transmitting Voltage Response (TVR).
3
Locate the Legends section. From the Legends list, choose Automatic.
4
In the Transmitting Voltage Response (TVR) toolbar, click  Plot.
The plot should look like Figure 10.
Directivity Index (DI)
1
In the Model Builder window, right-click Specific Acoustic Impedance and choose Duplicate.
2
In the Settings window for 1D Plot Group, type Directivity Index (DI) in the Label text field.
3
Locate the Plot Settings section. In the y-axis label text field, type DI (dB).
Global 1
1
In the Model Builder window, expand the Directivity Index (DI) node, then click Global 1.
2
In the Settings window for Global, click Replace Expression in the upper-right corner of the y-Axis Data section. From the menu, choose Component 1 (comp1)>Definitions>Variables>DI - Directivity index of tonpilz transducer.
3
Click Add Expression in the upper-right corner of the y-Axis Data section. From the menu, choose Component 1 (comp1)>Definitions>Variables>DI_fl_pist - Directivity index of flanged piston.
4
Locate the Legends section. From the Legends list, choose Automatic.
5
In the Directivity Index (DI) toolbar, click  Plot.
The plot should look like Figure 11.
Total Radiated Power
1
In the Model Builder window, right-click Directivity Index (DI) and choose Duplicate.
2
In the Settings window for 1D Plot Group, type Total Radiated Power in the Label text field.
3
Locate the Data section. From the Parameter selection (F_pre) list, choose All.
4
Locate the Plot Settings section. In the y-axis label text field, type Ptot (mW).
5
Locate the Legend section. From the Position list, choose Upper right.
Global 1
1
In the Model Builder window, expand the Total Radiated Power node, then click Global 1.
2
In the Settings window for Global, click Replace Expression in the upper-right corner of the y-Axis Data section. From the menu, choose Component 1 (comp1)>Definitions>Variables>Ptot - Total radiated power - W.
3
Locate the y-Axis Data section. In the table, enter the following settings:
4
In the Total Radiated Power toolbar, click  Plot.
The plot should look like Figure 12.
Electric Impedance
1
In the Home toolbar, click  Add Plot Group and choose 1D Plot Group.
2
In the Settings window for 1D Plot Group, type Electric Impedance in the Label text field.
3
Locate the Data section. From the Dataset list, choose Study 1/Parametric Solutions 1 (sol3).
4
Locate the Title section. From the Title type list, choose Label.
5
Locate the Plot Settings section. Select the Two y-axes check box.
6
Locate the Axis section. Select the y-axis log scale check box.
Global 1
1
Right-click Electric Impedance and choose Global.
2
In the Settings window for Global, locate the y-Axis Data section.
3
4
Locate the Coloring and Style section. Set the Width value to 2.
Global 2
1
Right-click Global 1 and choose Duplicate.
2
In the Settings window for Global, locate the y-Axis section.
3
Select the Plot on secondary y-axis check box.
4
Locate the y-Axis Data section. In the table, enter the following settings:
5
Locate the Coloring and Style section. Find the Line style subsection. From the Line list, choose Dotted.
6
From the Color list, choose Cycle (reset).
7
In the Electric Impedance toolbar, click  Plot.
The plot should look like Figure 13.
Grid 1D 2
1
In the Results toolbar, click  More Datasets and choose Grid>Grid 1D.
2
In the Settings window for Grid 1D, locate the Parameter Bounds section.
3
In the Minimum text field, type 30.
4
In the Maximum text field, type 90.
Variation of properties
1
In the Results toolbar, click  1D Plot Group.
2
In the Settings window for 1D Plot Group, type Variation of properties in the Label text field.
3
Locate the Title section. From the Title type list, choose Label.
4
Locate the Plot Settings section. Select the y-axis label check box.
5
6
Locate the Legend section. From the Position list, choose Lower right.
Line Graph 1
1
Right-click Variation of properties and choose Line Graph.
2
In the Settings window for Line Graph, locate the Data section.
3
From the Dataset list, choose Grid 1D 2.
4
From the Parameter selection (freq) list, choose Last.
5
Locate the y-Axis Data section. In the Expression text field, type c33_factor(x[1/mm][MPa]).
6
Locate the x-Axis Data section. From the Parameter list, choose Expression.
7
In the Expression text field, type x[1/mm][MPa].
8
Select the Description check box.
9
10
From the Unit list, choose MPa.
11
Click to expand the Legends section. Select the Show legends check box.
12
Find the Include subsection. Clear the Solution check box.
13
Select the Description check box.
14
Click to expand the Coloring and Style section. Set the Width value to 2.
15
In the Variation of properties toolbar, click  Plot.
Line Graph 2
1
Right-click Line Graph 1 and choose Duplicate.
2
In the Settings window for Line Graph, locate the y-Axis Data section.
3
In the Expression text field, type loss_factor(x[1/mm][MPa]).
Line Graph 3
1
Right-click Line Graph 2 and choose Duplicate.
2
In the Settings window for Line Graph, locate the y-Axis Data section.
3
In the Expression text field, type d33_factor(x[1/mm][MPa]).
4
In the Variation of properties toolbar, click  Plot.
Annotation 1
1
In the Model Builder window, right-click Variation of properties and choose Annotation.
2
In the Settings window for Annotation, locate the Coloring and Style section.
3
Clear the Show point check box.
4
Locate the Position section. In the x text field, type 30.
5
In the Variation of properties toolbar, click  Plot.
The plot should look like Figure 2.