PDF

Sound Transmission Loss Through
a Concrete Wall
Introduction
This model presents a practical and efficient method to compute the sound transmission loss (STL) through a building component, specifically this example treats the case of a concrete wall. The method, used here, is valid as long as the component has little influence on the acoustic field on the source side. The method is based on assuming an ideal diffuse field on the source side and an ideal anechoic termination on the receiver side of the concrete wall. In typical measurement setups, the diffuse sound field is generated in a reverberation room. At low frequencies, the fields that you can obtain are less than perfectly diffuse. The measured STL will therefore to some extent depend on the experimental conditions. From the approach used in this model, you can extract an ideal, experiment-independent STL. The obtained results are compared to published experimental data and shows good agreement.
Model Definition
In this tutorial, the sound transmission loss (STL) through a concrete wall will be modeled using an approach that is well suited for numerical simulations. A review of STL measurement techniques and theory is given below in order to motivate the simulation approach used here. Following this discussion, the method is described in detail.
Sound Transmission Loss (STL)
The STL through a building component, like a door, a window, a wall segment, or a sound insulation structure, is defined as the ratio of the total incident power Pin, on the structure, relative to the total transmitted power Ptr (measured on the dB scale),
(1)
The STL is defined for conditions where the acoustic field on the source side is a diffuse acoustic field. Several standards exist for the measurement of the STL, for example, ASTM E90 or ISO 10140. Common to the methods is that they are devised in order to directly or indirectly measure the incident and transmitted power using various methods. Typically, a so-called two-room method is used. The two most common configurations both use a reverberation room on the source side. The first also uses a reverberation room on the receiver side (reverberant-reverberant) while the second uses an anechoic room on the receiver side (reverberant-anechoic). The two configurations are sketched in Figure 1.
Figure 1: The two variations of the two-room configuration for measuring the sound transmission loss: (top) both source and receiver reverberation rooms, and (bottom) the source reverberation room and receiver anechoic room.
In both cases, the incident power on the source side is computed as
(2)
where Ss is the area of the test surface on the source side (the area of the concrete wall tested), prms is the RMS pressure in the source room, ρ is the density, and c is the speed of sound. This expression is derived by considering the incident power on a surface in an ideal diffuse acoustic field, see Ref. 1 and Ref. 2.
The expressions used to compute the incident and transmitted power for the reverberant-reverberant case are only valid as long as the acoustic field is diffuse. A measure for the transition from modal to diffuse behavior is given by the Schroeder frequency
(3)
where V is the room volume and T60 is the reverberation time; see Ref. 1. A room of volume V is said to be acoustically large when the studied frequency f is larger than the Schroeder frequency, giving the condition
(4)
Reverberant-Reverberant Setup
In the setup where also the receiver room is a reverberation room (Figure 1 top) and the sound field is assumed diffuse, the transmitted power is given by
(5)
where prms is the RMS pressure in the receiver room and Ar is the receiver room absorption, that is, the product of each area Si and its absorption coefficient αi. The expression stems from an energy balance consideration, that is, the total absorbed energy is equal to the radiated energy of a source. Combining Equation 2 and Equation 5 gives the expression for the STL for the reverberant-reverberant setup
(6)
where SPLs and SPLr is the average sound pressure level in the source and the receiver room, respectively. Averaging is of course done on the RMS pressure before transforming to the dB scale.
Note that a correction to Equation 5 is sometimes introduced (it is based on the Waterhouse expression). At walls (in a room with a diffuse field), the RMS pressure will be larger by a factor 2, because the incident and reflected fields are correlated, see Ref. 2. The expression reads
(7)
where Te is the early decay time, Vr is the receiver room volume, Sr,room the receiver room surface area, and λ is the wavelength.
Reverberant-Anechoic Setup
In the reverberant-anechoic configuration (Figure 1 bottom), the transmitted power is directly measured on the receiver side using an intensity probe. The measurement is performed in several locations in front of the test element and averaged. The transmitted power is then simply given by
(8)
combining this expression with Equation 1 and Equation 2 gives
(9)
for flat samples Ss = Sr and SILtr is the transmitted (measured) sound intensity level. The numeric constant stems directly from the definitions of SPL and SIL and the equations for the power, it is expressed as
(10)
where pref = 20 µPa, Iref = 10-12 W/m, ρ =1.2 kg/m3, and c = 343 m/s.
Figure 2: Schematic representation of the frequency dependency of the STL for panels made of isotropic materials.
Estimation Model for the STL
The STL for panels (like the wall studied here) has a general frequency dependent behavior that is sketched in Figure 2 for the case of isotropic elastic materials (see Ref. 3). At low frequencies, below the first mechanical (panel) resonance f11 of the structure, the STL is stiffness controlled. At and around the resonance the STL drops drastically as the structure acts as an optimal transmitter (dips can also occur for the second mode). Above the first resonance the STL becomes mass controlled. This is in a relatively large frequency band where the STL increases with 6 dB per octave. Then at the critical frequency fc, in a region called the coincidence region, the STL decreases. Coincidence happens when the wavelength of the pressure waves in the fluid are comparable to wavelength of the flexural waves in the structure. Above this region the STL increases. It is first damping controlled (9 dB per octave) before it approaches the mass law behavior again.
Several analytical perdition models exist for the STL for a simply supported panels (plastes or walls), see Ref. 3. In the mass law region one model, called Sharp’s equation (for 1/3 octave STL values), is given as
(11)
where m = ρsolid·T is the mass per unit area of the structure, ρsolid is the density of the structure, and T is the thickness of the panel (here the wall, see Figure 3). Note that the predicted STL from Sharp’s equation will in practice exceed the actual STL. This is because the equation assumes an ideal limp panel and does not take into account the panel stiffness. This same trend is seen in the model results discussed below. The slope in the mass law region will obey the 6 dB per octave trend. A doubling of the wall thickness will double the value of m and thus results in a 6 dB increase in STL for a given frequency.
Ideal Model Setup
When simulating the STL we want to avoid having to model the source and receiver rooms as this would be computationally extremely expensive. Instead the setup is based on assuming an ideal diffuse field on the source side and an ideal anechoic termination on the receiver side of the test sample (here a concrete wall). Experimentally measured STL values will to some extent depend on the experimental conditions. The model also assumes that the test sample has little influence on the sound field on the source side. This is true for relatively stiff structures with low acoustic absorption properties. This is the case for the concrete wall studied in this example. In this case the sound field on the source side (the source room) can be defined as a sum of N uncorrelated plane waves moving in random directions. The source room pressure field is then
(12)
where the polar angles and , and the phase are independent random numbers. In the model, a new set of random numbers is generated for each n in the sum. The term ensures that the field has a constant intensity for any choice of N. The theoretical limit, for large N, of the average RMS pressure in the room (measured away from walls) will then be .
At the concrete wall (placed in the x = 0 plane), the diffuse field is reflected. The reflected component of the field is
(13).
The reflected field is coherent with the incident field (as discussed for Equation 5). At the surface of the concrete well, the total pressure load applied to the structure is the sum of the diffuse room pressure and the reflected pressure
(14)
In the model, the room pressure, the reflected pressure, and wall pressures are defined as global variables.
Figure 3: Model setup of a concrete wall with an ideal diffuse field on the source side and an ideal anechoic termination on the receiver side.
The wall pressure pwall is applied as a load on the source side of the concrete wall. On the receiver side, a perfect anechoic room is modeled using an air domain terminated by a perfectly matched layer (PML). The model setup is sketched in Figure 3.
The concrete wall has a height of H = 4.37 m, a width of W = 2.84 m, and a thickness of T = 203 mm. The density of the concrete is ρcon = 2275 kg/m3, the Young’s modulus is Econ = 31.6 GPa, the Poisson ration is 0.2, and a typical value of 0.01 is used as the isotropic loss factor. The wall size and material data is taken from the test configuration called 76-77 described in Ref. 4. The wall is assumed fixed at its outer boundary and placed in an ideal surrounding wall that does not contribute to the STL.
Note that the fixed constraint used here is different from the “simply supported” condition (a hinge-like condition) often used in the analytical prediction models. To precisely predict measurements or model the behavior of building components in-situ a good description of the outer boundary conditions is of course required. The condition used will, for example, have a significant influence on the low frequency stiffness controlled behavior of the STL.
Results and Discussion
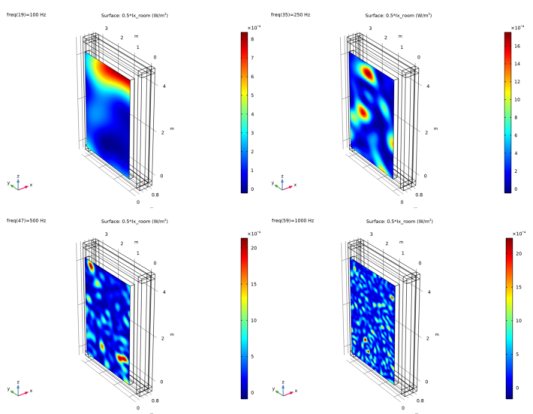
The incident intensity distribution on the concrete wall is depicted in Figure 4, evaluated at 100 Hz, 250 Hz, 500 Hz, and 1000 Hz. The distribution is not dependent on the solved model but only on the randomness and number of terms in the expression for the room pressure room pressure field proom from Equation 12.
Figure 4: The incident intensity evaluated in the concrete wall surface.
The incident intensity on the half space (in the x-direction) is computed using its definition as
(15)
where the extra factor 1/2 is necessary as it is only the incident component of the room field that should be used (half space contribution). The spatial distribution of the transmitted (radiated) intensity is depicted for the same frequencies in Figure 5. The transmitted intensity depends on the solved problem and is computed as
(16)
where pt is the total acoustic pressure and u is the structural displacement in the x direction. Both variables are solved for in the model.
Figure 5: The transmitted intensity evaluated on the concrete wall surface.
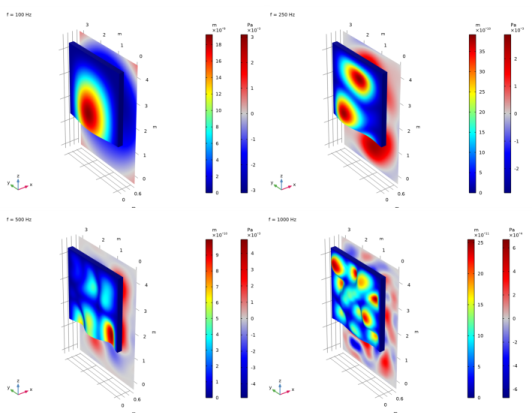
The displacement of the concrete wall, as well as the pressure in the receiver room, is depicted in Figure 6 for the same four frequencies. At the low frequencies, the displacement distribution is strongly dictated by the possible modes of the structure. Comparing this to Figure 5 it is also evident that the transmitted intensity field is controlled by the displacement.
Figure 6: The displacement of the concrete wall and the pressure on the receiver side.
The sound transmission loss (STL), computed using Equation 1, Equation 2, and Equation 8, is depicted in Figure 7 and Figure 8. The STL is depicted as a continuous line (evaluated for all the computed frequencies) as well as in octave bands or 1/3 octave bands, respectively. Both graphs also include the typically measured STL. The data is adapted from Ref. 4 and shows good agreement.
In Figure 7 the estimated STL using Sharp’s equation (see Equation 11) is also depicted in the region where the mass law applies. The estimate shows the same trend with the correct slope (6 dB per octave) but overestimates the STL. This is expected as Sharp’s equation assumes a limp structure and does not include the stiffness effects.
The dips in the STL curve correspond to the first two structural modes which are depicted in Figure 10. They occur at f11 = 113 Hz and f12 = 170 Hz. Below these frequencies the STL is stiffness controlled and depends highly on the boundary conditions applied to the structure. The mass law behavior applies above these.
Figure 7: Sound transmission loss (STL) through the concrete wall with octave bands.
Figure 8: Sound transmission loss (STL) through the concrete wall with 1/3 octave bands.
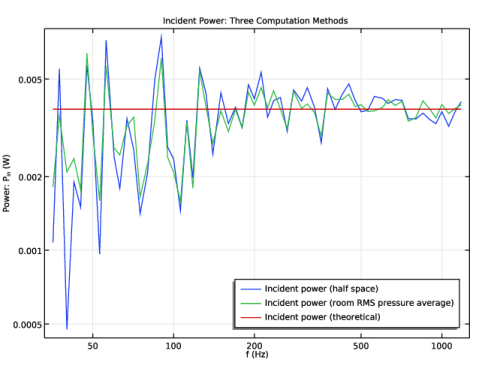
Finally, Figure 9 depicts the incident power on the wall computed using three different methods. The blue graph shows the value given by the surface integral of Equation 15. The green graph represents the value given by Equation 2 where the RMS pressure is given as the average of proom over the wall surface. The red graph is also computed using Equation 2 but with the RMS pressure set to the theoretical value . The graphs indicate the expected large fluctuations at low frequencies where the wavelength is comparable to the wall size. In measurement conditions the field would also not be diffuse at these low frequencies.
Figure 9: The incident power on the wall evaluated using three different methods.
Figure 10: The first three modes of the structure.
Notes About the COMSOL Implementation
The model is based on several assumptions:
If the test sample does not meet the last requirement, then the source field acoustics needs to be solved coupled with the structure. This can of course also be done.
References
1. H. Kuttruff, Room Acoustics, CRC Press, Fifth Edition, 2009.
2. F. Jacobsen, “The Sound Field in a Reverberation Room,” Lecture Note no. 31261, Acoustic, Technology, Technical University of Denmark, 2011.
3. D. A. Bies C. Hansen, and C. Howard, “Engineering Noise Control,” 5th Edition, CRC Press, 2017.
4. A. Litvin and H.W. Belliston, “Sound Transmission Loss Through Concrete and Concrete Masonry Walls,” American Concrete Institute, Journal Proceedings, vol. 45, pp. 641–646, 1978.
Application Library path: Acoustics_Module/Building_and_Room_Acoustics/sound_transmission_loss_concrete
Modeling Instructions
From the File menu, choose New.
New
In the New window, click  Model Wizard.
Model Wizard
1
In the Model Wizard window, click  3D.
2
In the Select Physics tree, select Acoustics>Acoustic-Structure Interaction>Acoustic-Solid Interaction, Frequency Domain.
3
Click Add.
4
Click  Study.
5
In the Select Study tree, select General Studies>Frequency Domain.
6
Global Definitions
Parameters 1
1
In the Model Builder window, under Global Definitions click Parameters 1.
2
In the Settings window for Parameters, locate the Parameters section.
3
Click  Load from File.
4
Create an interpolation function that contains typical measurement data of the STL for the concrete wall.
Interpolation 1 (int1)
1
In the Home toolbar, click  Functions and choose Global>Interpolation.
2
In the Settings window for Interpolation, locate the Definition section.
3
From the Data source list, choose File.
4
Click Browse.
5
Browse to the model’s Application Libraries folder and double-click the file sound_transmission_loss_concrete_measurement_data.txt.
6
Find the Functions subsection. In the table, enter the following settings:
7
Click Import.
8
Locate the Interpolation and Extrapolation section. From the Interpolation list, choose Piecewise cubic.
9
Locate the Units section. In the Arguments text field, type Hz.
10
In the Function text field, type dB.
Geometry 1
Block 1 (blk1)
1
In the Geometry toolbar, click  Block.
2
In the Settings window for Block, locate the Size and Shape section.
3
In the Width text field, type T.
4
In the Depth text field, type W.
5
In the Height text field, type H.
Block 2 (blk2)
1
In the Geometry toolbar, click  Block.
2
In the Settings window for Block, locate the Size and Shape section.
3
In the Width text field, type 3*T.
4
In the Depth text field, type W+4*T.
5
In the Height text field, type H+4*T.
6
Locate the Position section. In the x text field, type T.
7
In the y text field, type -2*T.
8
In the z text field, type -2*T.
9
Click to expand the Layers section. In the table, enter the following settings:
10
Find the Layer position subsection. Select the Right check box.
11
Select the Front check box.
12
Select the Back check box.
13
Select the Top check box.
14
Click  Build All Objects.
Pressure Acoustics, Frequency Domain (acpr)
1
In the Model Builder window, under Component 1 (comp1) click Pressure Acoustics, Frequency Domain (acpr).
2
Solid Mechanics (solid)
1
In the Model Builder window, under Component 1 (comp1) click Solid Mechanics (solid).
2
In the Settings window for Solid Mechanics, locate the Domain Selection section.
3
Click  Clear Selection.
4
Multiphysics
Acoustic-Structure Boundary 1 (asb1)
Click the  Wireframe Rendering button in the Graphics toolbar.
Add Material
1
In the Home toolbar, click  Add Material to open the Add Material window.
2
Go to the Add Material window.
3
4
Click Add to Component in the window toolbar.
5
In the Home toolbar, click  Add Material to close the Add Material window.
Materials
Concrete
1
In the Model Builder window, under Component 1 (comp1) right-click Materials and choose Blank Material.
2
In the Settings window for Material, type Concrete in the Label text field.
3
4
Locate the Material Contents section. In the table, enter the following settings:
Definitions
Variables: Diffuse Field
1
In the Model Builder window, under Component 1 (comp1) right-click Definitions and choose Variables.
2
In the Settings window for Variables, type Variables: Diffuse Field in the Label text field.
3
Locate the Variables section. Click  Load from File.
4
Browse to the model’s Application Libraries folder and double-click the file sound_transmission_loss_concrete_variables_diffuse.txt.
Variables: STL
1
In the Model Builder window, right-click Definitions and choose Variables.
2
In the Settings window for Variables, type Variables: STL in the Label text field.
3
Locate the Variables section. Click  Load from File.
4
Random 1 (rn1)
1
In the Home toolbar, click  Functions and choose Local>Random.
2
In the Settings window for Random, type costheta_rnd in the Function name text field.
3
Locate the Parameters section. In the Number of arguments text field, type 4.
4
In the Mean text field, type 0.5.
Random 2 (rn2)
1
In the Home toolbar, click  Functions and choose Local>Random.
2
In the Settings window for Random, type phi_rnd in the Function name text field.
3
Locate the Parameters section. In the Number of arguments text field, type 4.
4
In the Mean text field, type pi.
5
In the Range text field, type 2*pi.
Random 3 (rn3)
1
In the Home toolbar, click  Functions and choose Local>Random.
2
In the Settings window for Random, type phase_rnd in the Function name text field.
3
Locate the Parameters section. In the Number of arguments text field, type 4.
4
In the Mean text field, type pi.
5
In the Range text field, type 2*pi.
Integration 1 (intop1)
1
In the Definitions toolbar, click  Nonlocal Couplings and choose Integration.
2
In the Settings window for Integration, type intop_in in the Operator name text field.
3
Locate the Source Selection section. From the Geometric entity level list, choose Boundary.
4
Integration 2 (intop2)
1
In the Definitions toolbar, click  Nonlocal Couplings and choose Integration.
2
In the Settings window for Integration, type intop_tr in the Operator name text field.
3
Locate the Source Selection section. From the Geometric entity level list, choose Boundary.
4
Save solution on boundaries
1
In the Definitions toolbar, click  Explicit.
2
In the Settings window for Explicit, type Save solution on boundaries in the Label text field.
3
Locate the Input Entities section. From the Geometric entity level list, choose Boundary.
4
Perfectly Matched Layer 1 (pml1)
1
In the Definitions toolbar, click  Perfectly Matched Layer.
2
3
In the Settings window for Perfectly Matched Layer, locate the Scaling section.
4
In the PML scaling curvature parameter text field, type 2.
Solid Mechanics (solid)
Linear Elastic Material 1
In the Model Builder window, under Component 1 (comp1)>Solid Mechanics (solid) click Linear Elastic Material 1.
Damping 1
1
In the Physics toolbar, click  Attributes and choose Damping.
2
In the Settings window for Damping, locate the Damping Settings section.
3
From the Damping type list, choose Isotropic loss factor.
Remember to go back to the Concrete material and add the value for the isotropic loss factor.
Materials
Concrete (mat2)
1
In the Model Builder window, under Component 1 (comp1)>Materials click Concrete (mat2).
2
In the Settings window for Material, locate the Material Contents section.
3
Solid Mechanics (solid)
Fixed Constraint 1
1
In the Physics toolbar, click  Boundaries and choose Fixed Constraint.
2
The selection should look like this.
Boundary Load 1
1
In the Physics toolbar, click  Boundaries and choose Boundary Load.
2
3
In the Settings window for Boundary Load, locate the Force section.
4
From the Load type list, choose Pressure.
5
In the p text field, type p_wall.
The following steps show how to create a swept mesh to reduce the computation time.
Mesh 1
Free Quad 1
1
In the Mesh toolbar, click  Boundary and choose Free Quad.
2
Size
1
In the Model Builder window, click Size.
2
In the Settings window for Size, locate the Element Size section.
3
Click the Custom button.
4
Locate the Element Size Parameters section. In the Maximum element size text field, type c0/fmax/5.
5
In the Minimum element size text field, type c0/fmax/6.
Mapped 1
1
In the Mesh toolbar, click  Boundary and choose Mapped.
2
Distribution 1
1
Right-click Mapped 1 and choose Distribution.
2
3
In the Settings window for Distribution, locate the Distribution section.
4
In the Number of elements text field, type 8.
5
Click  Build All.
Swept 1
In the Mesh toolbar, click  Swept.
Distribution 1
1
Right-click Swept 1 and choose Distribution.
2
In the Settings window for Distribution, locate the Domain Selection section.
3
Click  Clear Selection.
4
5
Locate the Distribution section. In the Number of elements text field, type 2.
Distribution 2
1
In the Model Builder window, right-click Swept 1 and choose Distribution.
2
In the Settings window for Distribution, locate the Domain Selection section.
3
Click  Clear Selection.
4
Click the  Entity Intersects button in the Graphics toolbar.
5
6
Locate the Distribution section. In the Number of elements text field, type 8.
7
Click  Build All.
The mesh should look like this.
Study 1
Solution 1 (sol1)
1
In the Study toolbar, click  Show Default Solver.
The default solver works, but to reduce the computation time, enable the second suggested iterative solver. This solver is both faster and more memory efficient than the default direct solver. It uses a multigrid preconditioner for the acoustic variables and a direct preconditioner for the solid mechanics variables.
2
In the Model Builder window, expand the Solution 1 (sol1) node.
3
In the Model Builder window, expand the Study 1>Solver Configurations>Solution 1 (sol1)>Stationary Solver 1 node.
4
Right-click Study 1>Solver Configurations>Solution 1 (sol1)>Stationary Solver 1>Suggested Iterative Solver (GMRES with GMG and Direct Precond.) (asb1) and choose Enable.
Step 1: Frequency Domain
1
In the Model Builder window, click Step 1: Frequency Domain.
2
In the Settings window for Frequency Domain, locate the Study Settings section.
3
Click  Range.
4
In the Range dialog box, choose ISO preferred frequencies from the Entry method list.
5
In the Start frequency text field, type 35.
6
In the Stop frequency text field, type fmax.
7
From the Interval list, choose 1/12 octave.
8
Click Replace.
9
In the Settings window for Frequency Domain, click to expand the Values of Dependent Variables section.
10
Find the Store fields in output subsection. From the Settings list, choose For selections.
11
Under Selections, click  Add.
To reduce the model size when saved, only store the solution on the selected boundaries.
12
In the Add dialog box, select Save solution on boundaries in the Selections list.
13
14
In the Study toolbar, click  Compute.
Results
Acoustic Pressure (acpr)
Inspect the default plots generated, you can change the evaluation frequency if needed. Notice that the isosurface plot is less interesting as we have only stored the solution on boundaries.
Sound Pressure Level (acpr)
Acoustic Pressure, Isosurfaces (acpr)
Stress (solid)
Next, create plots of the incident and transmitted intensity, the displacement, as well as 1D plots of the STL.
Incident Intensity
1
In the Home toolbar, click  Add Plot Group and choose 3D Plot Group.
2
In the Settings window for 3D Plot Group, type Incident Intensity in the Label text field.
Surface 1
1
Right-click Incident Intensity and choose Surface.
2
In the Settings window for Surface, locate the Expression section.
3
In the Expression text field, type 0.5*Ix_room.
Selection 1
1
Right-click Surface 1 and choose Selection.
2
3
In the Incident Intensity toolbar, click  Plot.
The plot is depicted at four frequencies in Figure 4.
Transmitted Intensity
1
In the Home toolbar, click  Add Plot Group and choose 3D Plot Group.
2
In the Settings window for 3D Plot Group, type Transmitted Intensity in the Label text field.
Surface 1
1
Right-click Transmitted Intensity and choose Surface.
2
In the Settings window for Surface, locate the Expression section.
3
In the Expression text field, type Ix_tr.
Selection 1
1
Right-click Surface 1 and choose Selection.
2
3
In the Transmitted Intensity toolbar, click  Plot.
The plot is depicted at four frequencies in Figure 5.
Displacement
1
In the Home toolbar, click  Add Plot Group and choose 3D Plot Group.
2
In the Settings window for 3D Plot Group, type Displacement in the Label text field.
3
Click to expand the Title section. From the Title type list, choose Manual.
4
Select the Allow evaluation of expressions check box.
5
In the Parameter indicator text field, type f = eval(freq) Hz.
6
Locate the Plot Settings section. Clear the Plot dataset edges check box.
7
Locate the Color Legend section. Select the Show units check box.
Surface 1
1
Right-click Displacement and choose Surface.
2
In the Settings window for Surface, locate the Expression section.
3
In the Expression text field, type solid.disp.
Deformation 1
Right-click Surface 1 and choose Deformation.
Filter 1
1
In the Model Builder window, right-click Surface 1 and choose Filter.
2
In the Settings window for Filter, locate the Element Selection section.
3
In the Logical expression for inclusion text field, type z>1.5[m].
Surface 2
1
In the Model Builder window, right-click Displacement and choose Surface.
2
In the Settings window for Surface, locate the Coloring and Style section.
3
From the Color table list, choose Wave.
4
Select the Symmetrize color range check box.
Selection 1
1
Right-click Surface 2 and choose Selection.
2
3
In the Displacement toolbar, click  Plot.
The plot is depicted at four frequencies in Figure 6.
Postprocessing the STL variables is time consuming, so in order to save time setting up the next three plots (avoiding automatic plotting when formatting the plots), enable the Only plot when requested option.
4
In the Model Builder window, click Results.
5
In the Settings window for Results, locate the Update of Results section.
6
Select the Only plot when requested check box.
STL: P_in/P_tr (octaves)
1
In the Home toolbar, click  Add Plot Group and choose 1D Plot Group.
2
In the Settings window for 1D Plot Group, type STL: P_in/P_tr (octaves) in the Label text field.
3
Click to expand the Title section. From the Title type list, choose Manual.
4
In the Title text area, type Sound Transmission Loss (octaves).
5
Locate the Plot Settings section. Select the x-axis label check box.
6
7
Select the y-axis label check box.
8
9
Locate the Legend section. From the Position list, choose Lower left.
Octave Band 1
1
In the STL: P_in/P_tr (octaves) toolbar, click  More Plots and choose Octave Band.
2
In the Settings window for Octave Band, locate the Selection section.
3
From the Geometric entity level list, choose Global.
4
Locate the y-Axis Data section. From the Expression type list, choose Power.
5
In the Expression text field, type P_in.
6
In the Power reference text field, type P_tr.
7
Locate the Plot section. From the Style list, choose Continuous.
Octave Band 2
1
Right-click Octave Band 1 and choose Duplicate.
2
In the Settings window for Octave Band, locate the Plot section.
3
From the Style list, choose Octave bands.
4
Click to expand the Coloring and Style section. From the Type list, choose Outline.
Global 1
1
In the Model Builder window, right-click STL: P_in/P_tr (octaves) and choose Global.
2
In the Settings window for Global, locate the Data section.
3
From the Dataset list, choose Study 1/Solution 1 (sol1).
4
From the Parameter selection (freq) list, choose From list.
5
From the Parameter values list select the frequencies from 100 Hz to 1180 Hz, where the measurements are valid.
6
Locate the y-Axis Data section. In the table, enter the following settings:
7
In the STL: P_in/P_tr (octaves) toolbar, click  Plot.
The STL plot, with the octave evaluation, is depicted in Figure 7.
STL: P_in/P_tr (1/3 octaves)
1
Right-click STL: P_in/P_tr (octaves) and choose Duplicate.
2
In the Settings window for 1D Plot Group, type STL: P_in/P_tr (1/3 octaves) in the Label text field.
3
Locate the Title section. In the Title text area, type Sound Transmission Loss (1/3 octaves).
Octave Band 2
1
In the Model Builder window, expand the STL: P_in/P_tr (1/3 octaves) node, then click Octave Band 2.
2
In the Settings window for Octave Band, locate the Plot section.
3
From the Style list, choose 1/3 octave bands.
Global 2
1
In the Model Builder window, right-click STL: P_in/P_tr (1/3 octaves) and choose Global.
2
In the Settings window for Global, locate the Data section.
3
From the Dataset list, choose Study 1/Solution 1 (sol1).
4
From the Parameter selection (freq) list, choose From list.
5
From the Parameter values list select the frequencies from 200 Hz to 1180 Hz, to plot Sharp’s equation here.
6
Locate the y-Axis Data section. In the table, enter the following settings:
7
In the STL: P_in/P_tr (1/3 octaves) toolbar, click  Plot.
The STL plot, with the 1/3 octave evaluation and Sharp’s equation, is depicted in Figure 8.
Incident Power (three methods)
1
In the Home toolbar, click  Add Plot Group and choose 1D Plot Group.
2
In the Settings window for 1D Plot Group, type Incident Power (three methods) in the Label text field.
3
Click to collapse the Title section. Click to expand the Title section. From the Title type list, choose Manual.
4
In the Title text area, type Incident Power: Three Computation Methods.
5
Locate the Plot Settings section. Select the x-axis label check box.
6
7
Select the y-axis label check box.
8
In the associated text field, type Power: P<sub>in</sub> (W).
9
Locate the Axis section. Select the x-axis log scale check box.
10
Select the y-axis log scale check box.
11
Locate the Legend section. From the Position list, choose Lower right.
Global 1
1
Right-click Incident Power (three methods) and choose Global.
2
In the Settings window for Global, locate the y-Axis Data section.
3
4
In the Incident Power (three methods) toolbar, click  Plot.
The power plot is depicted in Figure 9.
Proceed and add a second study to perform an eigenfrequency analysis of the structure (the wall). When adding the study de-select the acoustic and the multiphysics coupling. In the analysis setup look for the first 3 modes.
Add Study
1
In the Home toolbar, click  Add Study to open the Add Study window.
2
Go to the Add Study window.
3
Find the Studies subsection. In the Select Study tree, select General Studies>Eigenfrequency.
4
Find the Physics interfaces in study subsection. In the table, clear the Solve check box for Pressure Acoustics, Frequency Domain (acpr).
5
Find the Multiphysics couplings in study subsection. In the table, clear the Solve check box for Acoustic-Structure Boundary 1 (asb1).
6
Click Add Study in the window toolbar.
7
In the Home toolbar, click  Add Study to close the Add Study window.
Study 2
Step 1: Eigenfrequency
1
In the Settings window for Eigenfrequency, locate the Study Settings section.
2
Select the Desired number of eigenfrequencies check box.
3
4
From the Eigenfrequency search method around shift list, choose Larger real part.
5
In the Home toolbar, click  Compute.
Results
Mode Shape (solid)
The first three structural modes are depicted in Figure 10. A table with the eigenvalues is also automatically generated. To see the table select the Eigenfrequencies (Study 2) evaluation group node.
Finally, disable the Only plot when requested option for the results. Turn On the option to Save plot data in order to avoid re-render the STL curves once the model is opened again.
1
In the Model Builder window, click Results.
2
In the Settings window for Results, locate the Update of Results section.
3
Clear the Only plot when requested check box.
4
Locate the Save Data in the Model section. From the Save plot data list, choose On.