PDF

Lumped Loudspeaker Driver
Introduction
This is a model of a moving-coil loudspeaker where a lumped parameter analogy represents the behavior of the electrical and mechanical speaker components. This lumped model is coupled to a 2D axisymmetric pressure acoustics model describing the surrounding air domain. The model is solved with two different configurations, first with an open back-volume and then with a closed back-volume. The main part of the analysis focuses on the open back-volume configuration.
Electric circuit representations of transducers are well known and widely used. In the loudspeaker industry such models have been employed for a long time and with great success. The parameters that characterize the low-frequency performance of a loudspeaker are commonly known as the Thiele-Small or the small-signal parameters. It is common to use these parameters to design and simulate a desired speaker performance in terms of, for example, the on-axis speaker response, the electrical impedance, and the diaphragm velocity.
In the low-frequency regime the motion of the speaker cone can be approximated by the motion of a rigid piston in an infinite baffle. Analytical expressions exist for the sound field radiated from a piston. In the model at hand, the simple piston geometry is replaced by a more realistic speaker cone shape, and the sound field is solved using the finite element method. Of course, this is still an approximation as the motion of the speaker cone is still assumed to be rigid; however, the spatial response of the speaker is more realistic. The methodology of lumping certain parts of a complex system is a general and powerful approach that can be applied to other systems. A first extension of the current model can be to only lump the electrical components and model the mechanical components fully.
The output from the model includes, among many things, the total electric impedance, the on-axis sound pressure level at a nominal driving voltage, and the mean speaker cone velocity. The results are compared with an analytical solution based on the flat piston approximation. Finally, it is also shown how to create a so-called directivity plot of the speaker.
Note: This application requires the Acoustics Module and the AC/DC Module.
Model Definition
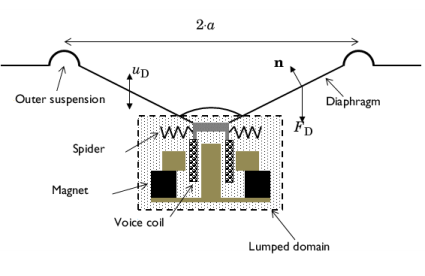
A schematic representation of a moving coil loudspeaker is given in Figure 1. The figure shows a cross section of a loudspeaker. The speaker driver is placed in an infinite baffle with free space in front and on the back of the speaker. This will be referred to as the open back-volume configuration. In the closed back-volume configuration a closed box is located behind the driver (see Figure 3). The speaker cone consists of the outer suspension, the diaphragm, and a dust cap (not marked in the figure). The mechanical and electrical components of the speaker that are lumped are visualized inside the dotted box. On the electrical side it includes the voice-coil and magnetic system (permanent magnet and pole pieces), and on the mechanical side it includes the moving mass of the voice coil and speaker cone, the spring effect of the spider and outer suspension, as well as possible losses due to damping in these suspensions. In the discussion below the lumped model of the driver itself is not concerned with the open or closed configuration of the back-volume. The effect of where the driver is located or how it is mounted in a system is modeled in the finite element domain.
Figure 1: Schematic representation of a moving coil speaker unit.
Electroacoustic Analogy
In an electroacoustic analogy, mechanical and acoustic physical properties such as force, velocity, pressure, and volume velocity are equated to voltages and currents in an analogous electrical circuit. In this model, the impedance analogy is used for the mechanical components only. This means that the current in the circuit represents the velocity of a moving part (SI unit: m/s) and the voltage represents a force (SI unit: N). In contrast, the acoustics is not represented by a circuit in this model. In general, however, in an acoustic analogous circuit, a voltage represents pressure (SI unit: Pa) and a current represents volume velocity (SI unit: m3/s).
The passive elements in a circuit — that is, resistors, inductors, and capacitors — represent different processes, namely resistance, mass movement, and compliance, respectively. The components and their analogs are listed in Table 1 (see also Ref. 1 for further details).
Resistor
SI unit: Ω
Mechanical resistance
SI unit: N·s/m
Losses due to friction, as in a car suspension.
Acoustic resistance
SI unit: kg/(m4·s)
Dissipative losses due to viscosity and thermal conduction in the fluid.
Inductor
SI unit: H
Mass
SI unit: kg
Inertial force, acceleration of a mass.
Acoustic mass
SI unit: kg/m4
Internal force of a volume of air that is accelerated but not compressed.
Capacitor
SI unit: F
Compliance
SI unit: m/N
The inverse of the spring constant.
Acoustic compliance
SI unit: m5/N
Compressibility effect of a volume of air that is not accelerated.
The active components in a circuit represent sources; they are external forces (pressures) or applied velocities (volume velocities). The sources are also used for couplings between the electrical, mechanical, and acoustic domains.
Note: To make the units fit in COMSOL, it is necessary to make unit transforms to fit the electrical units. When, for example, inserting a capacitor representing a mechanical compliance, CMS, in the physics interface type: C_MS[F*N/m]
The analogous circuit
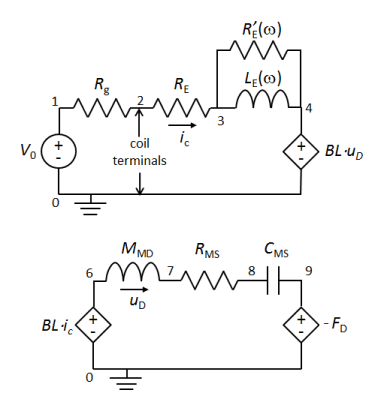
The analogous circuit for the electrical and mechanical parts of the system sketched in Figure 1 is shown in Figure 2. The upper figure represents the voice coil electrical system and the lower figure the mechanical analogue of the speaker cone, suspensions, and mass of the voice coil. In both figures the node numbers are also shown — they are very useful when setting up the circuit model in COMSOL.
In Figure 2 (top) the external voltage source is denoted by V0 and the generator output resistance is Rg, in this model Rg = 0 Ω. The voice coil resistance is RE, and the voice coil inductance is LE(ω), which is frequency dependent. The losses in the magnetic circuit are modeled through the frequency dependent resistance R'E(ω). The current controlled voltage source BL·uD, represents the back induced electromagnetic voltage generated when the voice coil (of length L) moves with velocity uD in the magnetic field B. Here BL is the product of the magnetic field strength and the voice coil length L (see also Ref. 2 on how this can be modeled). In the electrical circuit the current is denoted ic.
Figure 2: Analogous circuits for the electrical (top) and mechanical (bottom) properties of the speaker driver.
In the mechanical system given in Figure 2 (bottom) the current in the circuit is the velocity of the voice coil and speaker cone in the axial direction (see Figure 1). The force acting on the diaphragm is given by BL·ic. This is the Lorentz force on a voice coil of length L with current ic, where B is the magnetic flux density. The force acts on a system of mass MMD (voice coil and diaphragm assembly). The resistance RMS models the damping and CMS the mechanical compliance in the speaker suspensions (both spider and outer suspension). Finally, the voltage source -FD represents the pressure force acting on the speaker diaphragm (in the axial direction). Notice the minus sign that indicates that the force acts against the movement of the diaphragm (see Ref. 1). The force is given by
(1)
where Δp is the pressure drop across the diaphragm and nz is the axial component of the surface normal n (see Figure 1). This expression gives the couplings from the acoustic finite element model to the lumped circuit model. On the other hand, the coupling from the circuit model to the finite element model comes from specifying the velocity v on the surface of the diaphragm, which is given by
(2)
where ez is the unit vector in the axial direction (see Figure 3), uD is the current in the mechanical circuit analog, and multiplication with iω represents differentiation with respect to time.
Note: A version of this model using the Lumped Mechanical System interface also exists as a tutorial: Lumped Loudspeaker Driver Using a Lumped Mechanical System. In that model the mechanical part of the system uses the mobility analogy where the present model is based entirely on the impedance analogy. The model additionally requires the Structural Mechanics Module and the Multibody Dynamics Module.
Small-Signal Parameters
The fundamental small-signal parameters of the system (or Thiele-Small parameters) are the physical parameters of the loudspeaker driver. They are all constants, as they are given in the low-frequency limit of the model. See Table 2 below.
MMD
CMS
1.18·10-3 m/N
RMS
LE
RE
Ω
BL
SD
a2π
In Table 2 the radius a is the piston radius of the driver. It is typically taken as half the diaphragm aperture diameter, measured half-way into the outer suspension.
Note: The constants used in this model are all taken from Example 22 in Ref. 1.
Other small-signal parameters may be determined on basis of the fundamental small-signal parameters. Actually, these parameters are the ones measured when characterizing a driver; the fundamental parameters are inferred hereafter. The measured small-signal parameters are given in Table 3. In the table the speed of sound is denoted c0 and the density of air is ρ0. The values of these parameters are determined in the model using the Parameters feature under Global Definitions.
MMS
Fs
QES
Electrical Q factor at Fs
QMS
Mechanical Q factor at Fs
QTS
Total Q factor at Fs
VAS
η0
Other parameters
The model also uses other parameters than the small-signal parameters presented above. Two of them are the frequency dependent voice coil inductance LE(ω) and the resistance R'E(ω) associated with the losses in the magnetic system. A model for this is given in Ref. 1, for the higher audio frequencies, defining
where ne is the so-called voice coil loss factor. For ne = 1 and for in the low frequency limit the loss-less behavior is recovered where R'E is an open circuit and LE is constant. In this model ne = 0.7.
Another expression used in the model is the acoustic radiated power which is given by
(3)
where I is the intensity vector, whose components are defined in COMSOL as (acpr.Ir, acpr.Iz). The integral is taken over the front upper side of the speaker diaphragm. The electric input power (RMS value) is defined as
(4)
where * is the complex conjugate operator, and, finally, the speaker efficiency comparing the input electric power to the radiated acoustic power is
A number of the analytical results derived in Ref. 1, which are based on the piston approximation, are also used for comparison with the current more realistic speaker cone shape. They are the low-frequency and high-frequency approximations to the speaker velocity, the on-axis pressure at 1 m in front of the piston, and the acoustic radiated power from a piston in an infinite baffle. Expressions for these are given in the reference and under the variable node Component 1>Definitions>Analytical approximations in the model.
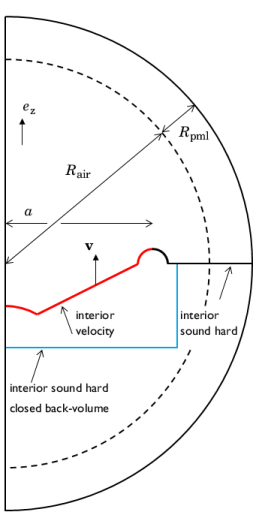
Figure 3: Computational domain and boundary conditions.
Finite Element Domain
The computational domain where the pressure acoustics model is solved is sketched in Figure 3. It represents the speaker cone, dust cap, and outer suspension, in an infinite baffle in a 2D axisymmetric model. On the speaker (red line), an interior velocity boundary condition is applied (according to Equation 2) and the rest of the baffle is an interior sound hard wall. In the closed back-volume configuration the blue line is also modeled an interior sound hard wall. In the open configuration no condition is applied to that boundary (it is transparent). The domain is truncated with a perfectly matched layer (PML) to mimic an infinite open domain. Note that the interior sound hard boundary of the baffle should be applied inside the PML. This is to avoid erroneous energy leaks between the two sides of the infinite baffle. The air domain has a radius of Rair while the thickness of the PML layer is Rpml. For more information about PMLs in acoustics, see the Modeling with the Pressure Acoustics Branch (FEM-Based Interfaces) section in the Pressure Acoustics Module User’s Guide.
Results and Discussion
In this section the results of the open back-volume configuration are first discussed in detail. Then selected results are presented for the closed back-volume configuration.
Open Back-Volume Configuration
The generated pressure field is shown in Figure 4 for 1 kHz and 5 kHz. This plot shows the directive characteristic of the speaker cone at increasing frequencies; this nature is discussed more at the end of this section when discussing the directivity plot Figure 11.
Figure 4: Acoustic pressure for a frequency of 1 kHz (top) and 5 kHz (bottom).
Figure 5: The frequency-dependent diaphragm velocity amplitude (upper left), acoustic radiated power (upper right), electric input power (lower left), and efficiency (lower right).
In Figure 5 and Figure 6 a series of characteristic loudspeaker driver curves are shown. In some figures the results obtained with the hybrid lumped and finite element of COMSOL are compared with theoretical curves that are based on the piston approximation.
In the upper left of Figure 5 the calculated speaker cone axial velocity uD is shown together with two theoretical curves representing the approximate high-frequency and low-frequency behavior of a piston driver (see Ref. 1). The general trend is that the low-frequency curve fits well for most of the frequency range. The high-frequency curve is seen to converge toward the higher frequencies. If you increase the frequency range of the model the trend is that the high-frequency approximation is a better fit as expected.
The next two graphs in Figure 5 (top right and bottom left) represent the acoustically radiated power PAR (see Equation 3) and the electric input power PE (see Equation 4). At the low frequencies the behavior is just as the piston model, as expected. The transition to nonmatching models occurs when the speaker diameter becomes comparable to half the wavelength at around 700 Hz. The last graph of Figure 5 represents the driver efficiency given in percent (%), that is, the ratio of the input electric power to the acoustic radiated power. The actual efficiency is seen to match well with the predicted reference efficiency η0 of about 1 %.
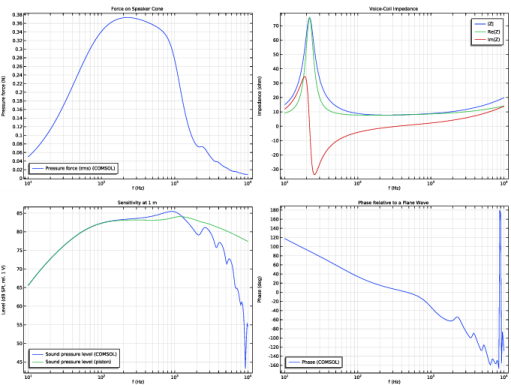
Figure 6: The frequency dependent pressure force on the speaker cone (rms value) (upper left), voice coil impedance (upper right), speaker sensitivity (lower left), and phase response (lower right).
In Figure 6 (upper left) the RMS value of the acoustic pressure force FD on the membrane (see Equation 1) is shown as function of frequency. The RMS value is obtained by the usual formula
where the * represents the complex conjugate.
Figure 6 (top right) represents the voice coil impedance (absolute value, real, and imaginary part) calculated as Vi/ic. The resonance in the electric system is seen to coincide with the fundamental resonance frequency Fs = 22.0 Hz (see Table 3 and the Global Definitions>Parameters list in the model).
The two last figures in Figure 6 (bottom left and right) represent the speaker response (sound pressure level) measured 1 m in front and driven at 1 V RMS and the relative phase measured in the same point. The sensitivity is seen to match the piston model at the low frequencies as expected and it has realistic values for a speaker unit. The phase is represented as the phase of the pressure p(0,1 m) relative to the phase a plane wave would have in the same point exp(−ik0z) with z = 1 m. In this way the pure distance (phase lag) component of the phase has been removed.
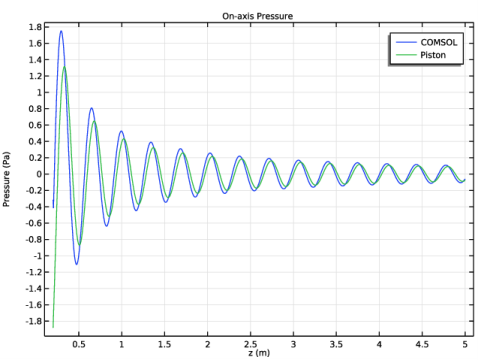
Figure 7: The pressure along the center z-axis from just outside the computational domain to a distance of 5 m. Evaluated for a frequency of 1000 Hz. The pressure is calculated using the exterior field calculation feature.
The pressure field along the z-axis is shown in Figure 7 from z = Rair to z = 5 m, evaluated at a frequency of 1000 Hz. In the model a Parametrized Curve 2D is used to evaluate the exterior-field pressure outside the computational mesh. The figure compares the modeled pressure with the analytical on axis pressure from a piston. The agreement is seen to be quite good at this frequency. For lower frequencies the agreement becomes much better while the two curves diverge at higher frequencies, as expected (change the evaluation frequency in the plot to see this trend).
Figure 8: Exterior-field pressure and sound pressure level evaluated at a distance of 1 m the half sphere in front of the speaker and at 10 kHz.
The pressure and the sound pressure level evaluated at 1 m, using the dedicated radiation pattern plots, are shown in Figure 8, here evaluated at 10 kHz. In the figure the 0° mark corresponds to the axial z direction. Both figures show a very strong directive pattern as expected at this high frequency.
In Figure 9 and Figure 10 the radiated intensity is illustrated and evaluated around the four frequencies 100 Hz, 1000 Hz, 5 kHz, and 10 kHz. The color plot represents the magnitude of the intensity vector I, the domain vector field represents the components of the intensity vector, and finally the vectors plotted on the edges represent the surface normals. The normals are useful when setting up, for example, the expression for the total radiated power (Equation 3). In this case it is necessary to use the up() operator to get the intensity on the upper side of the speaker cone (seen relative to the normal direction). The four plots clearly show how the acoustic energy is focused for increasing frequencies.
The so-called directivity plot of the speaker unit is shown in Figure 11. This plot represents a contour plot of the sound pressure level Lp evaluated along a half circle in front of the speaker as function of the angle and the frequency, that is, Lp(θ, f). As this plot is a more advanced and nonstandard plot in COMSOL the axis labels are a bit off. The x-axis represents the angle and actually runs from 90° to 90°. The y-axis is a logarithmic frequency axis running from 101 Hz to 104 Hz. The plot illustrates how the spatial response goes from a nearly omni-directional constant value at the low frequencies, through a single lobe response at intermediate frequencies, and ends up as a complex directive pattern at high frequencies. This type of plot is very often used, in industry, to characterize speakers and speaker units.
Figure 9: Intensity magnitude (color plot), intensity vector field (domain arrows), and surface normals (edge arrows) for 100 Hz and 1000 Hz.
Figure 10: Intensity magnitude (color plot), intensity vector field (domain arrows), and surface normals (edge arrows) for 5 kHz and for10 kHz.
Figure 11: Directivity plot for the speaker. The x-axis is a scaled azimuthal angle that runs from -90° to 90° and the y axis is a logarithmic frequency axis that runs from 101 Hz to 104 Hz = 10 kHz.
Closed Back-Volume Configuration
When the model is solved with the closed back-volume configuration, the response of the system changes. This is easily seen in the voice coil impedance curves in Figure 12. The location of the fundamental resonance frequency Fs is seen to increase. This is because the presence of the closed space behind the speaker diaphragm corresponds to an increased mechanical stiffness. The sensitivity of the speaker is depicted in Figure 13. The presence of the closed volume is seen to heavily influence the low frequency performance of the speaker. This is typically also why speaker cabinets have a ventilation port, that is, to reduce this low frequency roll off.
Testing the model with a closed back-volume also has the advantage of testing the entire model setup (the electrical circuit to FEM coupling). For example, a sign error in the applied pressure force on the diaphragm would give more or less correct results for the open configuration, but would not predict the expected resonance shift. This kind of sanity tests are important when setting up numerical models.
Figure 12: Voice coil impedance curves for both the open (solid) and closed (dashed) back-volume configurations.
Figure 13: Sensitivity curves for the open back-volume configuration, the analytical results, and the closed back-volume configuration.
References
1. W. Marshall Leach, Jr., Introduction to Electroacoustics and Audio Amplifier Design, Kendall Hunt, 2010.
2. Loudspeaker Driver Model Documentation, from the COMSOL Application Library.
Application Library path: Acoustics_Module/Electroacoustic_Transducers/lumped_loudspeaker_driver
Modeling Instructions
From the File menu, choose New.
New
In the New window, click  Model Wizard.
Model Wizard
1
In the Model Wizard window, click  2D Axisymmetric.
2
In the Select Physics tree, select Acoustics>Pressure Acoustics>Pressure Acoustics, Frequency Domain (acpr).
3
Click Add.
4
In the Select Physics tree, select AC/DC>Electrical Circuit (cir).
5
Click Add.
6
Click  Study.
7
In the Select Study tree, select General Studies>Frequency Domain.
8
Global Definitions
Load all the model parameters from a file; they include all the small signal parameters (Table 2 and Table 3) as well as geometry parameters.
Parameters 1
1
In the Model Builder window, under Global Definitions click Parameters 1.
2
In the Settings window for Parameters, locate the Parameters section.
3
Click  Load from File.
4
Build the simple 2D axisymmetric geometry of the speaker driver by drawing some circles and lines.
Geometry 1
Circle 1 (c1)
1
In the Geometry toolbar, click  Circle.
2
In the Settings window for Circle, locate the Size and Shape section.
3
In the Radius text field, type 1[cm].
4
In the Sector angle text field, type 180.
5
Locate the Position section. In the r text field, type a.
Circle 2 (c2)
1
In the Geometry toolbar, click  Circle.
2
In the Settings window for Circle, locate the Size and Shape section.
3
In the Radius text field, type Rair+Rpml.
4
In the Sector angle text field, type 180.
5
Locate the Rotation Angle section. In the Rotation text field, type -90.
6
Click to expand the Layers section. In the table, enter the following settings:
Polygon 1 (pol1)
1
In the Geometry toolbar, click  Polygon.
2
In the Settings window for Polygon, locate the Object Type section.
3
From the Type list, choose Open curve.
4
Locate the Coordinates section. In the table, enter the following settings:
Polygon 2 (pol2)
1
In the Geometry toolbar, click  Polygon.
2
In the Settings window for Polygon, locate the Object Type section.
3
From the Type list, choose Open curve.
4
Locate the Coordinates section. In the table, enter the following settings:
5
Click  Build All Objects.
6
Click the  Zoom Extents button in the Graphics toolbar.
Quadratic Bézier 1 (qb1)
1
In the Geometry toolbar, click  More Primitives and choose Quadratic Bézier.
2
In the Settings window for Quadratic Bézier, locate the Control Points section.
3
In row 2, set r to 1.8[cm].
4
In row 3, set r to 3[cm].
5
In row 1, set z to -3[cm].
6
In row 2, set z to -3.1[cm].
7
In row 3, set z to -4[cm].
8
Locate the Weights section. In the 2 text field, type 1.5.
9
Click  Build All Objects.
Delete Entities 1 (del1)
1
In the Model Builder window, right-click Geometry 1 and choose Delete Entities.
2
On the object c1, select Boundaries 3 and 4 only.
3
In the Settings window for Delete Entities, click  Build Selected.
Polygon 3 (pol3)
1
In the Geometry toolbar, click  Polygon.
2
In the Settings window for Polygon, locate the Object Type section.
3
From the Type list, choose Open curve.
4
Locate the Coordinates section. In the table, enter the following settings:
5
Click  Build All Objects.
Now, set up all the variables, selections, and component couplings under the Definitions node. Load the variables from the two variable files (one for model variables and one for the analytical piston expressions). The selections represent the speaker cone surface with an internal acceleration (red line in Figure 3) and the internal sound hard wall.
Definitions
Model variables
1
In the Home toolbar, click  Variables and choose Local Variables.
2
In the Settings window for Variables, type Model variables in the Label text field.
3
Locate the Variables section. Click  Load from File.
4
Analytical approximations
1
In the Home toolbar, click  Variables and choose Local Variables.
2
In the Settings window for Variables, type Analytical approximations in the Label text field.
3
Locate the Variables section. Click  Load from File.
4
Speaker
1
In the Definitions toolbar, click  Explicit.
2
In the Settings window for Explicit, type Speaker in the Label text field.
3
Locate the Input Entities section. From the Geometric entity level list, choose Boundary.
4
Baffle (interior wall)
1
In the Definitions toolbar, click  Explicit.
2
In the Settings window for Explicit, type Baffle (interior wall) in the Label text field.
3
Locate the Input Entities section. From the Geometric entity level list, choose Boundary.
4
Back Volume (interior wall)
1
In the Definitions toolbar, click  Explicit.
2
In the Settings window for Explicit, type Back Volume (interior wall) in the Label text field.
3
Locate the Input Entities section. From the Geometric entity level list, choose Boundary.
4
Integration 1 (intop1)
1
In the Definitions toolbar, click  Nonlocal Couplings and choose Integration.
2
In the Settings window for Integration, locate the Source Selection section.
3
From the Geometric entity level list, choose Boundary.
4
From the Selection list, choose Speaker.
5
In the Operator name text field, type intop.
Perfectly Matched Layer 1 (pml1)
1
In the Definitions toolbar, click  Perfectly Matched Layer.
2
3
In the Settings window for Perfectly Matched Layer, locate the Scaling section.
4
From the Coordinate stretching type list, choose Rational.
5
In the PML scaling factor text field, type 0.5.
6
In the PML scaling curvature parameter text field, type 5.
You have now changed the default settings for the perfectly matched layer (PML). The new settings will improve the performance of the PML at very low frequencies. First of all, the acoustic radiated power should be positive. If the default settings had been used you would see a negative radiated power at low frequencies (see Figure 5 (top right) and the instructions on how to create the plot, further down). The issue is that at low frequencies the evanescent waves created by the moving speaker cone extend into the PML layer. The interaction between the scaled coordinate system in the PML and these waves may create an erroneous energy contribution to the model (can be either positive or negative). Note that, the evanescent waves decay in only a fraction of a wavelength.
A good way to investigate the performance of the PML is to make a sensitivity analysis on some parameter (for example the total radiated acoustic power) with respect to changes in the PML parameters. In this model we do not perform such a sensitivity analysis.
In general, increasing the curvature factor effectively shifts the resolving power of the PML toward the physical domain, which is necessary in this case since the evanescent components decay in only a fraction of a wavelength. However, if you increase it too much, you may lose resolution in the other end, that is, of the free space wavelength. Assuming that the PMLs work properly for high frequencies and curvature parameter 1, you can in principle do a convergence study increasing a constant curvature parameter until the low-frequency result converges (for 10 Hz) while making sure that the high-frequency result (for 10 kHz) is not affected. It turns out that a value of 5 yields good results in this model. A scaling factor of 0.5 further improves the results, but only by a small amount. Decreasing the scaling factor corresponds to compressing the PML layer (shortening it), which in turn effectively increases the mesh resolution.
Add Material
1
In the Home toolbar, click  Add Material to open the Add Material window.
2
Go to the Add Material window.
3
4
Click Add to Component in the window toolbar.
5
In the Home toolbar, click  Add Material to close the Add Material window.
Now, set up the physics and the boundary conditions for the model. Use the interior conditions at the diaphragm and on the infinite baffle. This condition will allow for a discontinuous pressure field.
Pressure Acoustics, Frequency Domain (acpr)
Interior Sound Hard Boundary (Wall) 1
1
In the Model Builder window, under Component 1 (comp1) right-click Pressure Acoustics, Frequency Domain (acpr) and choose Interior Conditions>Interior Sound Hard Boundary (Wall).
2
In the Settings window for Interior Sound Hard Boundary (Wall), locate the Boundary Selection section.
3
From the Selection list, choose Baffle (interior wall).
Interior Normal Velocity 1
1
In the Physics toolbar, click  Boundaries and choose Interior Normal Velocity.
2
In the Settings window for Interior Normal Velocity, locate the Boundary Selection section.
3
From the Selection list, choose Speaker.
4
Locate the Interior Normal Velocity section. Specify the v0 vector as
Exterior Field Calculation 1
1
In the Physics toolbar, click  Boundaries and choose Exterior Field Calculation.
2
3
In the Settings window for Exterior Field Calculation, locate the Exterior Field Calculation section.
4
From the Condition in the z = z^0 plane list, choose Symmetric/Infinite sound hard boundary.
Note that, you have applied the exterior-field calculation condition only to the front of the speaker. In reality, the exterior-field condition should be applied to boundaries surrounding all sources and scatterers. This is of course not possible with an infinite baffle. However, in this specific case, a trick can be used, namely employing the fact that symmetry (in z = 0) is equal to a sound-hard wall in pressure acoustics (as indicated in the UI). So, in the infinite baffle configuration, the exterior-field condition can still be used.
Interior Sound Hard Boundary (Wall) 2
1
In the Physics toolbar, click  Boundaries and choose Interior Sound Hard Boundary (Wall).
2
In the Settings window for Interior Sound Hard Boundary (Wall), locate the Boundary Selection section.
3
From the Selection list, choose Back Volume (interior wall).
This interior wall condition will be deactivated in the first study when modeling the open configuration. In the second study the interior wall is active and the speaker operates with a closed back-volume.
Proceed to set up the electric circuit system for the electric and mechanical model. When building this look at Figure 3 for the references to the node numbers used in the model.
Electrical Circuit (cir)
In the Model Builder window, under Component 1 (comp1) click Electrical Circuit (cir).
Voltage Source 1 (V1)
1
In the Electrical Circuit toolbar, click  Voltage Source.
2
In the Settings window for Voltage Source, locate the Node Connections section.
3
4
Locate the Device Parameters section. In the vsrc text field, type V0.
Resistor 1 (R1)
1
In the Electrical Circuit toolbar, click  Resistor.
2
In the Settings window for Resistor, locate the Node Connections section.
3
4
Locate the Device Parameters section. In the R text field, type R_g.
Resistor 2 (R2)
1
In the Electrical Circuit toolbar, click  Resistor.
2
In the Settings window for Resistor, locate the Node Connections section.
3
4
Locate the Device Parameters section. In the R text field, type R_E.
Inductor 1 (L1)
1
In the Electrical Circuit toolbar, click  Inductor.
2
In the Settings window for Inductor, locate the Node Connections section.
3
4
Locate the Device Parameters section. In the L text field, type L_E.
Resistor 3 (R3)
1
In the Electrical Circuit toolbar, click  Resistor.
2
In the Settings window for Resistor, locate the Node Connections section.
3
4
Locate the Device Parameters section. In the R text field, type Rp_E.
Current-Controlled Voltage Source 1 (H1)
1
In the Electrical Circuit toolbar, click  Current-Controlled Voltage Source.
2
In the Settings window for Current-Controlled Voltage Source, locate the Node Connections section.
3
4
Locate the Device Parameters section. In the Gain text field, type BL[m/Wb*ohm].
Remember to select the measured current when the mechanical circuit components have been set up.
Current-Controlled Voltage Source 2 (H2)
1
In the Electrical Circuit toolbar, click  Current-Controlled Voltage Source.
2
In the Settings window for Current-Controlled Voltage Source, locate the Node Connections section.
3
4
Locate the Device Parameters section. In the Gain text field, type BL[m/Wb*ohm].
5
Locate the Current Measurement section. From the Measure current for device list, choose Resistor 2 (R2).
Inductor 2 (L2)
1
In the Electrical Circuit toolbar, click  Inductor.
2
In the Settings window for Inductor, locate the Node Connections section.
3
4
Locate the Device Parameters section. In the L text field, type M_MD[H/kg].
Current-Controlled Voltage Source 1 (H1)
1
In the Model Builder window, click Current-Controlled Voltage Source 1 (H1).
2
In the Settings window for Current-Controlled Voltage Source, locate the Current Measurement section.
3
From the Measure current for device list, choose Inductor 2 (L2).
Resistor 4 (R4)
1
In the Electrical Circuit toolbar, click  Resistor.
2
In the Settings window for Resistor, locate the Node Connections section.
3
4
Locate the Device Parameters section. In the R text field, type R_MS[ohm/kg*s].
Capacitor 1 (C1)
1
In the Electrical Circuit toolbar, click  Capacitor.
2
In the Settings window for Capacitor, locate the Node Connections section.
3
4
Locate the Device Parameters section. In the C text field, type C_MS[F*N/m].
Voltage Source 2 (V2)
1
In the Electrical Circuit toolbar, click  Voltage Source.
2
In the Settings window for Voltage Source, locate the Node Connections section.
3
4
Locate the Device Parameters section. In the vsrc text field, type -F_D[V/N].
The applied force is an external force (pressure acting on the membrane). When the force is increased the velocity of the membrane should decrease and vice versa.
Now, build the mesh. It consists of a triangular mesh around the speaker and an extruded mesh in the PML region. In the boundary where the exterior-field is calculated add a single boundary layer. For more details on this look at the model Acoustic Scattering off an Ellipsoid in the Application Library.
Mesh 1
Free Triangular 1
1
In the Mesh toolbar, click  Free Triangular.
2
In the Settings window for Free Triangular, locate the Domain Selection section.
3
From the Geometric entity level list, choose Domain.
4
Size
1
In the Model Builder window, click Size.
2
In the Settings window for Size, locate the Element Size section.
3
Click the Custom button.
4
Locate the Element Size Parameters section. In the Maximum element size text field, type 343[m/s]/fmax/8.
5
In the Minimum element size text field, type 343[m/s]/fmax/100.
Mapped 1
1
In the Mesh toolbar, click  Mapped.
2
In the Settings window for Mapped, click  Build All.
Boundary Layers 1
1
In the Mesh toolbar, click  Boundary Layers.
2
In the Settings window for Boundary Layers, locate the Domain Selection section.
3
From the Geometric entity level list, choose Domain.
4
5
Click to expand the Transition section. Clear the Smooth transition to interior mesh check box.
Boundary Layer Properties
1
In the Model Builder window, click Boundary Layer Properties.
2
3
In the Settings window for Boundary Layer Properties, locate the Boundary Layer Properties section.
4
In the Number of boundary layers text field, type 1.
5
From the Thickness of first layer list, choose Manual.
6
In the Thickness text field, type 343[m/s]/fmax/100.
7
Click  Build All.
Study 1 - Open Back-Volume
1
In the Model Builder window, click Study 1.
2
In the Settings window for Study, type Study 1 - Open Back-Volume in the Label text field.
Step 1: Frequency Domain
1
In the Model Builder window, under Study 1 - Open Back-Volume click Step 1: Frequency Domain.
2
In the Settings window for Frequency Domain, locate the Study Settings section.
3
Click  Range.
4
In the Range dialog box, choose ISO preferred frequencies from the Entry method list.
5
In the Start frequency text field, type 10.
6
In the Stop frequency text field, type 10000.
7
From the Interval list, choose 1/24 octave.
8
Click Replace.
Disable the interior wall that defines the closed back-volume for this first study where we use the open configuration.
9
In the Settings window for Frequency Domain, locate the Physics and Variables Selection section.
10
Select the Modify model configuration for study step check box.
11
In the Physics and variables selection tree, select Component 1 (comp1)>Pressure Acoustics, Frequency Domain (acpr)>Interior Sound Hard Boundary (Wall) 2.
12
Click  Disable.
13
In the Home toolbar, click  Compute.
Results
Acoustic Pressure (acpr)
First, look at the default plots. Investigate the 2D Sound Pressure Level (acpr) plot to verify the performance of the perfectly matched layer (PML). After doing this you can disable plotting in the PML region, which is unphysical. Secondly, look at the default exterior-field plots and make a few changes, before setting up a range of plots to investigate the loudspeaker driver performance.
Sound Pressure Level (acpr)
Look at the sound pressure level (SPL) plots at the frequencies of 10 kHz, 1 kHz, and 10 Hz. Note that the SPL decreases nearly 100 dB over the width of the thickness of the PML. This means that the outgoing waves are extremely damped.
14
In the Model Builder window, click Sound Pressure Level (acpr).
15
In the Settings window for 2D Plot Group, locate the Data section.
16
From the Parameter value (freq (Hz)) list, choose 1000.
17
In the Sound Pressure Level (acpr) toolbar, click  Plot.
18
From the Parameter value (freq (Hz)) list, choose 10.
19
In the Sound Pressure Level (acpr) toolbar, click  Plot.
Study 1 - Open Back-Volume/Solution 1 (sol1)
In the Model Builder window, expand the Results>Datasets node, then click Study 1 - Open Back-Volume/Solution 1 (sol1).
Selection
1
In the Results toolbar, click  Attributes and choose Selection.
2
In the Settings window for Selection, locate the Geometric Entity Selection section.
3
From the Geometric entity level list, choose Domain.
4
Acoustic Pressure (acpr)
1
In the Model Builder window, click Acoustic Pressure (acpr).
2
In the Settings window for 2D Plot Group, locate the Data section.
3
From the Parameter value (freq (Hz)) list, choose 1000.
4
In the Acoustic Pressure (acpr) toolbar, click  Plot.
5
Click the  Zoom Extents button in the Graphics toolbar.
6
From the Parameter value (freq (Hz)) list, choose 5000.
7
In the Acoustic Pressure (acpr) toolbar, click  Plot.
These two plots should reproduce Figure 4.
Acoustic Pressure, 3D (acpr)
Sound Pressure Level, 3D (acpr)
Radiation Pattern 1
1
In the Model Builder window, expand the Exterior-Field Sound Pressure Level (acpr) node, then click Radiation Pattern 1.
2
In the Settings window for Radiation Pattern, locate the Evaluation section.
3
Find the Angles subsection. From the Restriction list, choose Manual.
4
In the φ start text field, type -90.
5
In the φ range text field, type 180.
6
In the Exterior-Field Sound Pressure Level (acpr) toolbar, click  Plot.
Radiation Pattern 1
1
In the Model Builder window, expand the Exterior-Field Pressure (acpr) node, then click Radiation Pattern 1.
2
In the Settings window for Radiation Pattern, locate the Evaluation section.
3
Find the Angles subsection. From the Restriction list, choose Manual.
4
In the φ start text field, type -90.
5
In the φ range text field, type 180.
6
In the Exterior-Field Pressure (acpr) toolbar, click  Plot.
These two polar plots should reproduce Figure 8.
Now, create nine 1D plots that depict various speaker characteristic plots. Each plot includes a number of steps to setup the title, the axis, the plot name etc., these are optional and can be skipped. You can also just create the specific plot that is of interest to you. The next steps reproduce the graphs in Figure 5, Figure 6, and Figure 7.
The plots are the following:
1
2
3
4
5
6
7
8
9
Diaphragm Velocity
1
In the Home toolbar, click  Add Plot Group and choose 1D Plot Group.
2
In the Settings window for 1D Plot Group, type Diaphragm Velocity in the Label text field.
3
Click to expand the Title section. From the Title type list, choose Label.
4
Locate the Plot Settings section. Select the x-axis label check box.
5
6
Select the y-axis label check box.
7
In the associated text field, type Velocity amplitude (m/s).
Global 1
1
Right-click Diaphragm Velocity and choose Global.
2
In the Settings window for Global, locate the y-Axis Data section.
3
4
In the Diaphragm Velocity toolbar, click  Plot.
5
Click the  x-Axis Log Scale button in the Graphics toolbar.
This plot should reproduce Figure 5 (top left).
Acoustic Radiated Power
1
In the Home toolbar, click  Add Plot Group and choose 1D Plot Group.
2
In the Settings window for 1D Plot Group, type Acoustic Radiated Power in the Label text field.
3
Locate the Title section. From the Title type list, choose Label.
4
Locate the Plot Settings section. Select the x-axis label check box.
5
6
Select the y-axis label check box.
7
8
Locate the Legend section. From the Position list, choose Lower middle.
Global 1
1
Right-click Acoustic Radiated Power and choose Global.
2
In the Settings window for Global, click Add Expression in the upper-right corner of the y-Axis Data section. From the menu, choose Component 1 (comp1)>Definitions>Variables>P_AR - Radiated power (COMSOL) - W.
3
Click Add Expression in the upper-right corner of the y-Axis Data section. From the menu, choose Component 1 (comp1)>Definitions>Variables>P_AR_ana - Radiated power (piston) - W.
4
In the Acoustic Radiated Power toolbar, click  Plot.
5
Click the  x-Axis Log Scale button in the Graphics toolbar.
This plot should reproduce Figure 5 (top right).
Electric Input Power
1
In the Home toolbar, click  Add Plot Group and choose 1D Plot Group.
2
In the Settings window for 1D Plot Group, type Electric Input Power in the Label text field.
3
Locate the Title section. From the Title type list, choose Label.
4
Locate the Plot Settings section. Select the x-axis label check box.
5
6
Select the y-axis label check box.
7
8
Locate the Legend section. From the Position list, choose Lower right.
Global 1
1
Right-click Electric Input Power and choose Global.
2
In the Settings window for Global, click Replace Expression in the upper-right corner of the y-Axis Data section. From the menu, choose Component 1 (comp1)>Definitions>Variables>P_E - Electric input power (rms) - W.
3
In the Electric Input Power toolbar, click  Plot.
4
Click the  x-Axis Log Scale button in the Graphics toolbar.
This plot should reproduce Figure 5 (bottom left).
Driver Efficiency
1
In the Home toolbar, click  Add Plot Group and choose 1D Plot Group.
2
In the Settings window for 1D Plot Group, type Driver Efficiency in the Label text field.
3
Locate the Title section. From the Title type list, choose Label.
4
Locate the Plot Settings section. Select the x-axis label check box.
5
6
Select the y-axis label check box.
7
8
Locate the Legend section. From the Position list, choose Lower middle.
Global 1
1
Right-click Driver Efficiency and choose Global.
2
In the Settings window for Global, locate the y-Axis Data section.
3
4
In the Driver Efficiency toolbar, click  Plot.
5
Click the  x-Axis Log Scale button in the Graphics toolbar.
This plot should reproduce Figure 5 (bottom right).
Force on Speaker Cone
1
In the Home toolbar, click  Add Plot Group and choose 1D Plot Group.
2
In the Settings window for 1D Plot Group, type Force on Speaker Cone in the Label text field.
3
Locate the Title section. From the Title type list, choose Label.
4
Locate the Plot Settings section. Select the x-axis label check box.
5
6
Select the y-axis label check box.
7
8
Locate the Legend section. From the Position list, choose Lower left.
Global 1
1
Right-click Force on Speaker Cone and choose Global.
2
In the Settings window for Global, locate the y-Axis Data section.
3
4
In the Force on Speaker Cone toolbar, click  Plot.
5
Click the  x-Axis Log Scale button in the Graphics toolbar.
This plot should reproduce Figure 6 (top left).
Voice-Coil Impedance
1
In the Home toolbar, click  Add Plot Group and choose 1D Plot Group.
2
In the Settings window for 1D Plot Group, type Voice-Coil Impedance in the Label text field.
3
Locate the Title section. From the Title type list, choose Label.
4
Locate the Plot Settings section. Select the x-axis label check box.
5
6
Select the y-axis label check box.
7
Global 1
1
Right-click Voice-Coil Impedance and choose Global.
2
In the Settings window for Global, locate the y-Axis Data section.
3
4
In the Voice-Coil Impedance toolbar, click  Plot.
5
Click the  x-Axis Log Scale button in the Graphics toolbar.
This plot should reproduce Figure 6 (top right).
Sensitivity at 1 m
1
In the Home toolbar, click  Add Plot Group and choose 1D Plot Group.
2
In the Settings window for 1D Plot Group, type Sensitivity at 1 m in the Label text field.
3
Locate the Title section. From the Title type list, choose Label.
4
Locate the Plot Settings section. Select the x-axis label check box.
5
6
Select the y-axis label check box.
7
In the associated text field, type Level (dB SPL rel. 1 V).
8
Locate the Legend section. From the Position list, choose Lower left.
Octave Band 1
1
In the Sensitivity at 1 m toolbar, click  More Plots and choose Octave Band.
2
In the Settings window for Octave Band, locate the Selection section.
3
From the Geometric entity level list, choose Global.
4
Locate the y-Axis Data section. In the Expression text field, type pext(0,1).
5
Locate the Plot section. From the Style list, choose Continuous.
6
Click to expand the Legends section. Select the Show legends check box.
7
From the Legends list, choose Manual.
8
9
In the Sensitivity at 1 m toolbar, click  Plot.
Octave Band 2
1
Right-click Octave Band 1 and choose Duplicate.
2
In the Settings window for Octave Band, locate the y-Axis Data section.
3
In the Expression text field, type sqrt(2)*prms.
4
Locate the Legends section. In the table, enter the following settings:
5
In the Sensitivity at 1 m toolbar, click  Plot.
This plot should reproduce Figure 6 (bottom left).
Phase Relative to a Plane Wave
1
In the Home toolbar, click  Add Plot Group and choose 1D Plot Group.
2
In the Settings window for 1D Plot Group, type Phase Relative to a Plane Wave in the Label text field.
3
Locate the Title section. From the Title type list, choose Label.
4
Locate the Plot Settings section. Select the x-axis label check box.
5
6
Select the y-axis label check box.
7
8
Locate the Legend section. From the Position list, choose Lower left.
Global 1
1
Right-click Phase Relative to a Plane Wave and choose Global.
2
In the Settings window for Global, locate the y-Axis Data section.
3
4
In the Phase Relative to a Plane Wave toolbar, click  Plot.
5
Click the  x-Axis Log Scale button in the Graphics toolbar.
This plot should reproduce Figure 6 (bottom right).
Set up a parameterized curve used to evaluate the exterior-field outside of the computational mesh.
Parameterized Curve 2D 1
1
In the Results toolbar, click  More Datasets and choose Parameterized Curve 2D.
2
In the Settings window for Parameterized Curve 2D, locate the Expressions section.
3
In the z text field, type s*5[m]+(1-s)*Rair.
4
Select the Only evaluate globally defined expressions check box.
On-axis Pressure
1
In the Results toolbar, click  1D Plot Group.
2
In the Settings window for 1D Plot Group, type On-axis Pressure in the Label text field.
3
Locate the Data section. From the Dataset list, choose Parameterized Curve 2D 1.
4
Locate the Title section. From the Title type list, choose Label.
5
Locate the Plot Settings section. Select the x-axis label check box.
6
7
Select the y-axis label check box.
8
9
Locate the Data section. From the Parameter selection (freq) list, choose From list.
10
In the Parameter values (freq (Hz)) list, select 1000.
Line Graph 1
1
Right-click On-axis Pressure and choose Line Graph.
2
In the Settings window for Line Graph, locate the y-Axis Data section.
3
In the Expression text field, type pext(r,z).
4
Locate the x-Axis Data section. From the Parameter list, choose Expression.
5
In the Expression text field, type z.
6
Click to expand the Quality section. From the Resolution list, choose Extra fine.
7
Click to expand the Legends section. Select the Show legends check box.
8
From the Legends list, choose Manual.
9
Line Graph 2
1
Right-click Line Graph 1 and choose Duplicate.
2
In the Settings window for Line Graph, locate the y-Axis Data section.
3
In the Expression text field, type acpr.iomega*rho0*u_D*S_D*exp(-i*k0*z)/(2*pi*z).
4
Locate the Legends section. In the table, enter the following settings:
5
In the On-axis Pressure toolbar, click  Plot.
This plot should reproduce Figure 7.
Create a 2D intensity plot that includes the magnitude of the intensity vector acpr.I_rms as well as an arrow surface (vector field plot) of the intensity vector, with the components (acpr.Ir,acpr.Iz).
Intensity
1
In the Home toolbar, click  Add Plot Group and choose 2D Plot Group.
2
In the Settings window for 2D Plot Group, type Intensity in the Label text field.
Surface 1
1
Right-click Intensity and choose Surface.
2
In the Settings window for Surface, locate the Expression section.
3
In the Expression text field, type acpr.I_rms.
Arrow Surface 1
1
In the Model Builder window, right-click Intensity and choose Arrow Surface.
2
In the Settings window for Arrow Surface, click Replace Expression in the upper-right corner of the Expression section. From the menu, choose Component 1 (comp1)>Pressure Acoustics, Frequency Domain>Intensity>acpr.Ir,acpr.Iz - Intensity.
3
Locate the Coloring and Style section. From the Color list, choose Black.
Arrow Line 1
1
Right-click Intensity and choose Arrow Line.
2
In the Settings window for Arrow Line, click Replace Expression in the upper-right corner of the Expression section. From the menu, choose Component 1 (comp1)>Pressure Acoustics, Frequency Domain>Geometry>acpr.nr,acpr.nz - Normal vector.
3
Locate the Coloring and Style section. From the Color list, choose Gray.
4
In the Intensity toolbar, click  Plot.
5
Click the  Zoom Extents button in the Graphics toolbar.
This plot should reproduce the last frame in Figure 10, now change the evaluation frequency to 5000 Hz, 1000 Hz, and 100 Hz. This will reproduce the remaining frames in Figure 9 and Figure 10.
Intensity
1
In the Model Builder window, click Intensity.
2
In the Settings window for 2D Plot Group, locate the Data section.
3
From the Parameter value (freq (Hz)) list, choose 5000.
4
In the Intensity toolbar, click  Plot.
5
From the Parameter value (freq (Hz)) list, choose 1000.
6
In the Intensity toolbar, click  Plot.
7
From the Parameter value (freq (Hz)) list, choose 100.
8
In the Intensity toolbar, click  Plot.
Next create the directivity plot of the speaker.
Directivity
1
In the Home toolbar, click  Add Plot Group and choose 1D Plot Group.
2
In the Settings window for 1D Plot Group, type Directivity in the Label text field.
Directivity 1
1
In the Directivity toolbar, click  More Plots and choose Directivity.
2
In the Settings window for Directivity, locate the Evaluation section.
3
Find the Angles subsection. In the Number of angles text field, type 180.
4
From the Restriction list, choose Manual.
5
In the φ start text field, type -90.
6
In the φ range text field, type 180.
7
Click to expand the Coloring and Style section. From the Layout list, choose Frequency on y-axis.
8
In the Directivity toolbar, click  Plot.
9
Click the  y-Axis Log Scale button in the Graphics toolbar.
This should reproduce the directivity plot depicted in Figure 11. You can tailor the plot to your needs using the normalization options or defining the specific levels to use in the contour plot.
Create an additional plot that shows the sensitivity and the phase in one plot using two y-axes.
Global 1
In the Model Builder window, right-click Global 1 and choose Copy.
Sensitivity and Phase
1
In the Model Builder window, right-click Sensitivity at 1 m and choose Duplicate.
2
In the Settings window for 1D Plot Group, type Sensitivity and Phase in the Label text field.
3
Locate the Title section. From the Title type list, choose Label.
Octave Band 2
1
In the Model Builder window, expand the Sensitivity and Phase node.
2
Right-click Octave Band 2 and choose Delete.
Octave Band 1
1
In the Model Builder window, click Octave Band 1.
2
In the Settings window for Octave Band, locate the Plot section.
3
From the Style list, choose 1/3 octave bands.
Global 1
1
In the Model Builder window, right-click Sensitivity and Phase and choose Paste Global.
2
In the Settings window for Global, click to expand the Coloring and Style section.
3
In the Width text field, type 2.
4
From the Color list, choose Red.
Sensitivity and Phase
1
In the Model Builder window, click Sensitivity and Phase.
2
In the Settings window for 1D Plot Group, locate the Plot Settings section.
3
Select the Two y-axes check box.
4
In the table, select the Plot on secondary y-axis check box for Global 1.
5
Locate the Axis section. Select the Manual axis limits check box.
6
In the y minimum text field, type 40.
7
In the y maximum text field, type 90.
8
In the Secondary y minimum text field, type -180.
9
In the Secondary y maximum text field, type 180.
10
Locate the Plot Settings section. Select the Secondary y-axis label check box.
11
12
In the Sensitivity and Phase toolbar, click  Plot.
It is time to solve the model with the closed back-volume configuration. After solving add a few extra graphs to the existing plots to see how the system response has changed. The closed back-volume acts as a spring and thus modifies the mechanical compliance of the system. The effect is, for example, seen in the electrical impedance plot by moving the resonance up in frequency.
Add Study
1
In the Home toolbar, click  Add Study to open the Add Study window.
2
Go to the Add Study window.
3
Find the Studies subsection. In the Select Study tree, select General Studies>Frequency Domain.
4
Click Add Study in the window toolbar.
5
In the Home toolbar, click  Add Study to close the Add Study window.
Study 2
Step 1: Frequency Domain
1
In the Settings window for Frequency Domain, locate the Study Settings section.
2
Click  Range.
3
In the Range dialog box, choose ISO preferred frequencies from the Entry method list.
4
In the Start frequency text field, type 10.
5
In the Stop frequency text field, type 10000.
6
From the Interval list, choose 1/24 octave.
7
Click Replace.
8
In the Model Builder window, click Study 2.
9
In the Settings window for Study, type Study 2 - Closed Back-Volume in the Label text field.
10
Locate the Study Settings section. Clear the Generate default plots check box.
11
In the Home toolbar, click  Compute.
Finally, modify two of the existing plots to understand the effect of a closed-back volume. To see the results of the closed configuration, in any of the plots, simply change the Dataset to the one from study 2.
Results
Global 1
1
In the Model Builder window, under Results>Voice-Coil Impedance click Global 1.
2
In the Settings window for Global, locate the y-Axis Data section.
3
Global 2
1
Right-click Results>Voice-Coil Impedance>Global 1 and choose Duplicate.
2
In the Settings window for Global, locate the Data section.
3
From the Dataset list, choose Study 2 - Closed Back-Volume/Solution 2 (sol2).
4
Locate the y-Axis Data section. In the table, enter the following settings:
5
Locate the Coloring and Style section. From the Color list, choose Cycle (reset).
6
Find the Line style subsection. From the Line list, choose Dashed.
7
In the Voice-Coil Impedance toolbar, click  Plot.
This plot should reproduce Figure 12.
Octave Band 1
1
In the Model Builder window, click Octave Band 1.
2
In the Settings window for Octave Band, locate the Legends section.
3
Octave Band 3
1
Right-click Results>Sensitivity at 1 m>Octave Band 1 and choose Duplicate.
2
In the Settings window for Octave Band, locate the Data section.
3
From the Dataset list, choose Study 2 - Closed Back-Volume/Solution 2 (sol2).
4
Locate the Legends section. In the table, enter the following settings:
5
In the Sensitivity at 1 m toolbar, click  Plot.
This plot should reproduce Figure 13.