PDF

Modeling a Capacitive Position Sensor Using BEM
Introduction
This electrostatics tutorial model uses the Electrostatics, Boundary Elements physics interface to model a five-terminal capacitive sensor and compute its capacitance matrix. The interelectrode capacitances (capacitance matrix elements) are influenced by the presence of a metallic test object and the model is solved for a range of test object positions. The model serves as a tutorial on how to extract lumped parameter matrices using the Stationary Source Sweep study. It is similar to the Modeling a Capacitive Position Sensor Using FEM model that uses the finite element method (FEM) featured in the Electrostatics physics interface. That model also provides a more comprehensive description of the Stationary Source Sweep study functionality. The main focus of this model is on how to use the boundary element method (BEM) for the task of analyzing the sensor.
Model Definition
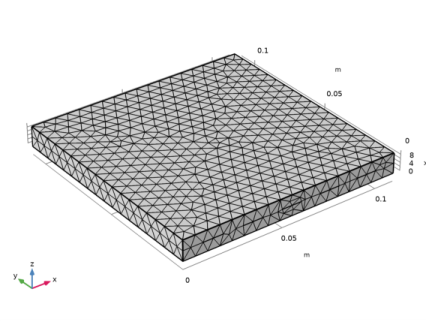
When using FEM, it is required to have a volumetric mesh in a portion of the surrounding air and in all dielectrics. An advantage of BEM is that meshing is only needed for object surfaces. More generally, the mesh is needed only on conductor surfaces and at the interfaces where dielectric properties change. For modeling the sensor and the infinite surrounding space, building the boundary mesh represented in Figure 1 is enough.
Figure 1: Mesh of the sensor.
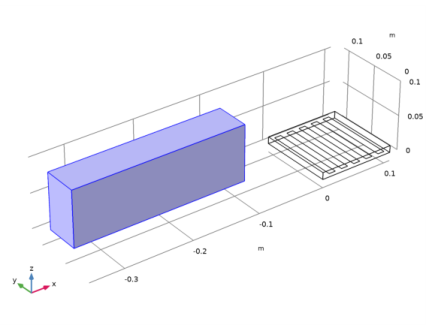
Similarly, when introducing the metallic test object, the full geometry is shown in Figure 2 and Figure 3 (in different positions). An air domain is not necessary, and only the natural object boundaries need to be included.
Figure 2: Test object when it is far from the sensor.
Figure 3: Test object when it is approaching the sensor.
Moreover, since the metallic block moves as a rigid body, there is no need to create a new mesh when its position changes. The translation of the mesh is obtained by using the Deformed Geometry physics interface. This also adds the additional requirement to have a volumetric mesh in the moving domain as the Prescribed Deformation feature is only available on the domain level.
Results and Discussion
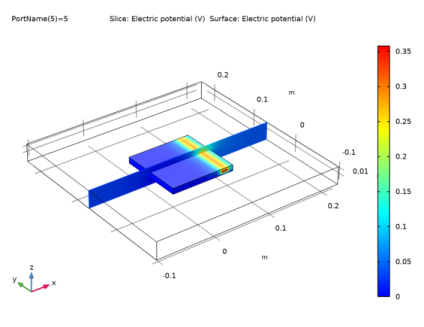
Even though there is no mesh in the air, COMSOL Multiphysics produces default plots of the fields in volumes. One such electric potential plot is shown in Figure 4, where a slice of the electric potential in air is represented.
Figure 4: Electric potential in the infinite space outside the object.
As for the FEM-based Electrostatics interface, the capacitance matrix output is provided. Figure 5 represents the mutual capacitance matrix, in units of pF, when the test object is absent.
FEM and BEM results agree within an error margin of about 8% (considering the absolute value of the Maxwell capacitance). Changes in capacitance due to the sensed object are reproduced within about 1%. FEM and BEM should be seen as complementary methods. Both are suitable for studying the capacitive position sensor system. The preferred method depends on the details of the simulation.
Figure 5: Mutual capacitance matrix.
Figure 6 and Figure 7 show the electric potential (log scale) with the first terminal excited and, when the test object is far from or just above the sensor, respectively. The presence of the metallic block changes the accumulated surface charge on the sensor electrodes and influences their capacitance values.
Figure 6: Cut plane of the electric potential (log scale) when the metallic block is far from the sensor.
Figure 7: Cut plane of the electric potential (log scale) when the metallic block is above the sensor.
The BEM model accounts for the change in capacitance when the object is far away a lot more accurately. It can be verified that the absolute capacitance for the position shown in Figure 2 already has changed on the order of a percent with respect to the complete absence of the object.
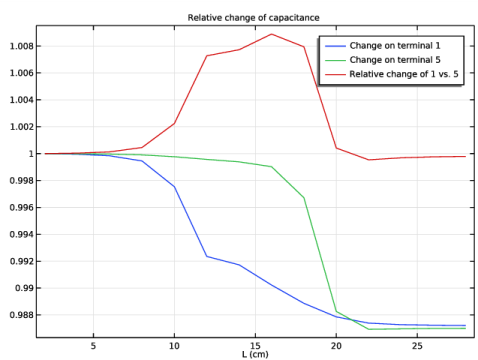
The response of the inverse Maxwell capacitance for different positions of the test object is shown in Figure 8. The relative change is shown with respect to when the block is in the position shown in Figure 2. The blue curve in Figure 8 represents the change in inverse Maxwell self-capacitance of the electrode that initially is closest to the test object. The green curve represents the change in inverse Maxwell self-capacitance of the electrode that initially is farthest from the test object.
The absolute capacitance of an electrode may exhibit a long-term drift, so measuring relative changes in interelectrode capacitance is more robust. The ratio of relative change in inverse Maxwell self-capacitance of the first versus the last electrode is represented by the red curve in Figure 8. It is clear that the test object produces a change in the response of the nearest electrode with respect to the farthest electrode. This can trigger properly designed feeding circuitry that detects the presence of the object.
Figure 8: Change in inverse Maxwell capacitance as a function of position of the incoming metal object. The blue and green lines are the absolute changes of the nearest and the farthest electrodes, respectively. The ratio of relative change of the nearest to the farthest electrode is shown in red.
Application Library path: ACDC_Module/Tutorials/capacitive_position_sensor_bem
Modeling Instructions
From the File menu, choose New.
New
In the New window, click  Model Wizard.
Model Wizard
1
In the Model Wizard window, click  3D.
2
In the Select Physics tree, select AC/DC>Electric Fields and Currents>Electrostatics, Boundary Elements (esbe).
3
Click Add.
4
Click  Study.
5
In the Select Study tree, select Preset Studies for Selected Physics Interfaces>Stationary Source Sweep.
6
Geometry 1
Block 1 (blk1)
1
In the Geometry toolbar, click  Block.
2
In the Settings window for Block, locate the Size and Shape section.
3
In the Width text field, type 11[cm].
4
In the Depth text field, type 11[cm].
5
In the Height text field, type 1[cm].
Work Plane 1 (wp1)
1
In the Geometry toolbar, click  Work Plane.
2
In the Settings window for Work Plane, locate the Plane Definition section.
3
In the z-coordinate text field, type 5[mm].
4
Click  Show Work Plane.
Work Plane 1 (wp1)>Rectangle 1 (r1)
1
In the Work Plane toolbar, click  Rectangle.
2
In the Settings window for Rectangle, locate the Size and Shape section.
3
In the Width text field, type 1[cm].
4
In the Height text field, type 11[cm].
5
Locate the Position section. In the xw text field, type 1[cm].
Work Plane 1 (wp1)>Array 1 (arr1)
1
In the Work Plane toolbar, click  Transforms and choose Array.
2
3
In the Settings window for Array, locate the Size section.
4
In the xw size text field, type 5.
5
Locate the Displacement section. In the xw text field, type 2[cm].
6
Click  Build Selected.
Work Plane 1 (wp1)
1
In the Model Builder window, click Work Plane 1 (wp1).
2
In the Settings window for Work Plane, click  Build Selected.
3
Click the  Wireframe Rendering button in the Graphics toolbar.
The next operations are needed to load materials. Pay special attention to the fact that Air, which is not necessarily explicitly modeled in a boundary element approach, will be added to the Infinite void entity, available under the Domain Geometric entity level.
Add Material
1
In the Home toolbar, click  Add Material to open the Add Material window.
2
Go to the Add Material window.
3
4
Click  Add to Component 1 (comp1).
5
In the tree, select Built-in>Nylon.
6
Click  Add to Component 1 (comp1).
7
In the Home toolbar, click  Add Material to close the Add Material window.
Materials
Nylon (mat2)
Select Domain 1 only.
Air (mat1)
1
In the Model Builder window, click Air (mat1).
2
In the Settings window for Material, locate the Geometric Entity Selection section.
3
From the Selection list, choose All voids.
Electrostatics, Boundary Elements (esbe)
Charge Conservation 2
1
In the Model Builder window, under Component 1 (comp1) right-click Electrostatics, Boundary Elements (esbe) and choose Charge Conservation.
2
Add ground and terminals for the feeding.
Ground 1
1
In the Physics toolbar, click  Boundaries and choose Ground.
2
Terminal 1
1
In the Physics toolbar, click  Boundaries and choose Terminal.
2
Terminal 2
1
In the Physics toolbar, click  Boundaries and choose Terminal.
2
Terminal 3
1
In the Physics toolbar, click  Boundaries and choose Terminal.
2
Terminal 4
1
In the Physics toolbar, click  Boundaries and choose Terminal.
2
Terminal 5
1
In the Physics toolbar, click  Boundaries and choose Terminal.
2
Generate the physics induced mesh for the sensor, which should be similar Figure 1 in the introduction.
Mesh 1
1
In the Model Builder window, under Component 1 (comp1) click Mesh 1.
2
In the Settings window for Mesh, locate the Physics-Controlled Mesh section.
3
From the Element size list, choose Finer.
4
Click  Build All.
The problem could be directly solved as it is, but for optimizing solution performance, direct solver and linear elements are selected.
Electrostatics, Boundary Elements (esbe)
1
In the Model Builder window, under Component 1 (comp1) click Electrostatics, Boundary Elements (esbe).
2
In the Settings window for Electrostatics, Boundary Elements, click to expand the Discretization section.
3
From the Electric potential/Surface charge density list, choose Linear/Linear.
Study 1
Solution 1 (sol1)
1
In the Study toolbar, click  Show Default Solver.
2
In the Model Builder window, expand the Solution 1 (sol1) node.
3
In the Model Builder window, expand the Study 1>Solver Configurations>Solution 1 (sol1)>Stationary Solver 1 node.
4
Right-click Study 1>Solver Configurations>Solution 1 (sol1)>Stationary Solver 1>Direct and choose Enable.
5
In the Study toolbar, click  Compute.
Results
Electric Potential, Domains (esbe)
Make the following modification to the default graphs to reproduce figures in the introduction. Notice that the potential is displayed also in the unmeshed air regions.
Slice 1
1
In the Model Builder window, expand the Electric Potential, Domains (esbe) node, then click Slice 1.
2
In the Settings window for Slice, locate the Plane Data section.
3
From the Plane list, choose zx-planes.
4
In the Planes text field, type 1.
5
In the Electric Potential, Domains (esbe) toolbar, click  Plot.
The next operations generate the lumped capacitance matrices and a 2D plot of the mutual capacitance matrix. The plot should be similar to Figure 5 in the introduction.
Maxwell capacitance (esbe, dset1)
1
In the Model Builder window, expand the Results>Derived Values node, then click Maxwell capacitance (esbe, dset1).
2
In the Settings window for Global Matrix Evaluation, locate the Expression section.
3
From the Unit list, choose 1/pF.
Mutual capacitance (esbe, dset1)
1
In the Model Builder window, click Mutual capacitance (esbe, dset1).
2
In the Settings window for Global Matrix Evaluation, locate the Expression section.
3
From the Unit list, choose 1/pF.
4
In the Results toolbar, click  Evaluate and choose Clear and Evaluate All.
Table
1
Go to the Table window.
2
Click Table Surface in the window toolbar.
Results
Table Surface 1
1
In the Model Builder window, under Results>2D Plot Group 5 click Table Surface 1.
2
In the Settings window for Table Surface, locate the Data section.
3
From the Data format list, choose Cells.
4
Locate the Coloring and Style section. From the Function list, choose Discrete.
2D Plot Group 5
1
In the Model Builder window, click 2D Plot Group 5.
2
In the Settings window for 2D Plot Group, click to expand the Title section.
3
From the Title type list, choose Manual.
4
In the Title text area, type Mutual capacitance matrix [pF].
5
In the 2D Plot Group 5 toolbar, click  Plot.
6
Click the  Zoom Extents button in the Graphics toolbar.
Addition of the sensed metallic object
Next, a metallic block is placed close to the sensor. The accumulated charge on the terminals will be influenced by the block. This makes it possible to determine the position of the block. As air does not need to be modeled, remeshing is not strictly necessary. To avoid remeshing the displacement is included by adding a Deformed Geometry physics interface, meshing sensor and block in their base position. The displacement L is then applied to the Deformed Geometry and does not appear in the geometry.
Global Definitions
Parameters 1
1
In the Model Builder window, under Global Definitions click Parameters 1.
2
In the Settings window for Parameters, locate the Parameters section.
3
Geometry 1
Block 2 (blk2)
1
In the Geometry toolbar, click  Block.
2
In the Settings window for Block, locate the Size and Shape section.
3
In the Width text field, type 25[cm].
4
In the Depth text field, type 5[cm].
5
In the Height text field, type 8[cm].
6
Locate the Position section. In the x text field, type -35[cm].
7
In the y text field, type 3[cm].
8
In the z text field, type 2[cm].
9
Click  Build All Objects.
Add Physics
1
In the Home toolbar, click  Add Physics to open the Add Physics window.
2
Go to the Add Physics window.
3
In the tree, select Mathematics>Deformed Mesh>Deformed Geometry (dg).
4
Click Add to Component 1 in the window toolbar.
5
In the Home toolbar, click  Add Physics to close the Add Physics window.
Deformed Geometry (dg)
Select Domain 1 only.
Prescribed Deformation 1
1
Right-click Component 1 (comp1)>Deformed Geometry (dg) and choose Prescribed Deformation.
2
In the Settings window for Prescribed Deformation, locate the Prescribed Mesh Displacement section.
3
In the dX text-field array, type L on the first row.
4
The block boundaries are defined as an equipotential with no net accumulated charge, by assigning the Floating Potential boundary condition to the block boundaries. In this model, there is no need to know the interior material properties of the block as there will be no resulting electric fields inside.
Electrostatics, Boundary Elements (esbe)
In the Model Builder window, under Component 1 (comp1) click Electrostatics, Boundary Elements (esbe).
Floating Potential 1
1
In the Physics toolbar, click  Boundaries and choose Floating Potential.
2
3
In the Model Builder window, click Electrostatics, Boundary Elements (esbe).
4
Click in the Graphics window and then press Ctrl+A to select both domains.
Mesh 1
1
In the Model Builder window, under Component 1 (comp1) click Mesh 1.
2
In the Settings window for Mesh, locate the Physics-Controlled Mesh section.
3
From the Element size list, choose Extremely fine.
4
Click  Build All.
Study 1
Parametric Sweep
1
In the Study toolbar, click  Parametric Sweep.
2
In the Settings window for Parametric Sweep, locate the Study Settings section.
3
4
5
Click  Range.
6
In the Range dialog box, type 2 in the Start text field.
7
In the Step text field, type 2.
8
In the Stop text field, type 28.
9
Click Replace.
10
In the Study toolbar, click  Compute.
Once the solution is generated, the postprocessing can be performed. The creation of the cut plane in air is first performed.
Results
Surface 1
1
In the Model Builder window, expand the Results>Electric Potential, Domains (esbe) 1 node.
2
Right-click Surface 1 and choose Disable.
Electric Potential, Domains (esbe) 1
1
In the Model Builder window, click Electric Potential, Domains (esbe) 1.
2
In the Settings window for 3D Plot Group, locate the Data section.
3
Click  Go to Source.
Grid 3D 2
1
In the Model Builder window, click Grid 3D 2.
2
In the Settings window for Grid 3D, locate the Parameter Bounds section.
3
Find the First parameter subsection. In the Minimum text field, type -0.2.
4
In the Maximum text field, type 0.2.
5
Click to expand the Resolution section. In the x resolution text field, type 100.
Slice 1
1
In the Model Builder window, click Slice 1.
2
In the Settings window for Slice, locate the Plane Data section.
3
From the Plane list, choose zx-planes.
4
In the Electric Potential, Domains (esbe) 1 toolbar, click  Plot.
5
In the Planes text field, type 1.
6
In the Electric Potential, Domains (esbe) 1 toolbar, click  Plot.
7
Click the  Go to Default View button in the Graphics toolbar.
8
Click the  Zoom Extents button in the Graphics toolbar.
Electric Potential, Domains (esbe) 1
1
In the Model Builder window, click Electric Potential, Domains (esbe) 1.
2
In the Settings window for 3D Plot Group, locate the Data section.
3
From the Parameter value (L (cm)) list, choose 2.
As the potential differences due to the change of position for the moving object are difficult to notice in linear scale, display the logarithm of the electric potential.
4
In the Electric Potential, Domains (esbe) 1 toolbar, click  Plot.
Slice 1
1
In the Model Builder window, click Slice 1.
2
In the Settings window for Slice, locate the Expression section.
3
In the Expression text field, type log10(esbe.V).
4
Click to expand the Range section. Select the Manual color range check box.
5
In the Minimum text field, type -4.
6
In the Maximum text field, type 0.
7
In the Electric Potential, Domains (esbe) 1 toolbar, click  Plot.
Electric Potential, Domains (esbe) 1
1
In the Model Builder window, click Electric Potential, Domains (esbe) 1.
2
In the Settings window for 3D Plot Group, locate the Data section.
3
From the Parameter value (PortName) list, choose 1.
The resulting plot for the object positioned far from the sensing electrodes should be similar to Figure 6 in the introduction. By changing the value of the displacement L, plots of the potential at other positions can be produced.
4
In the Electric Potential, Domains (esbe) 1 toolbar, click  Plot.
5
From the Parameter value (L (cm)) list, choose 10.
Finally, a plot of the change of the capacitance as a function of the change in position of the object is produced. The results are similar to those in the Capacitive Position Sensor tutorial model, where the Electrostatics physics interface is used. The discrepancies between the results are mainly due to the different boundary conditions.
1D Plot Group 10
1
In the Home toolbar, click  Add Plot Group and choose 1D Plot Group.
2
In the Settings window for 1D Plot Group, locate the Data section.
3
From the Dataset list, choose Study 1/Parametric Solutions 1 (sol2).
4
From the Parameter selection (PortName) list, choose First.
5
Click to expand the Title section. From the Title type list, choose Manual.
6
In the Title text area, type Relative change of capacitance.
Global 1
1
Right-click 1D Plot Group 10 and choose Global.
2
In the Settings window for Global, locate the y-Axis Data section.
3
4
Locate the x-Axis Data section. From the Axis source data list, choose L.
5
Click to expand the Legends section. From the Legends list, choose Manual.
6
7
In the 1D Plot Group 10 toolbar, click  Plot. The resulting plot should reproduce Figure 8 in the introduction.