View (3D)
The View node () for 3D components has many options to add light sources and define the light attributes. Other functions include displaying or hiding geometry labels, transparency, wireframe rendering, a numbered grid, and axis orientation in the Graphics window. See Figure 6-16. You can add this View node by right-clicking Definitions in a 3D component and also by right-clicking Views under Results to add a View 3D node.
Also right-click the View node in the component to add Hide for Geometry, Hide for Physics, or Hide for Mesh Import, depending on your current view.
Figure 6-16: An example of the top of the 3D Settings window for View with all View option check boxes selected. The Graphics window shows what the check boxes represent. In this example, using the Diagonal Mounting Detail of a Communication Mast model, the Fixed Constraint node is clicked in the Model Builder, which then displays the numbers associated to the boundaries (8, 9, 33, and 42). Compare to the boundary numbers shown in Figure 6-14, which is for the same node. The edge direction arrows are not displayed in this view.
Also right-click the View node in the component to add Hide for Geometry, Hide for Physics, or Hide for Mesh Import, depending on your current view.
The View node () for 3D models has the following sections:
View
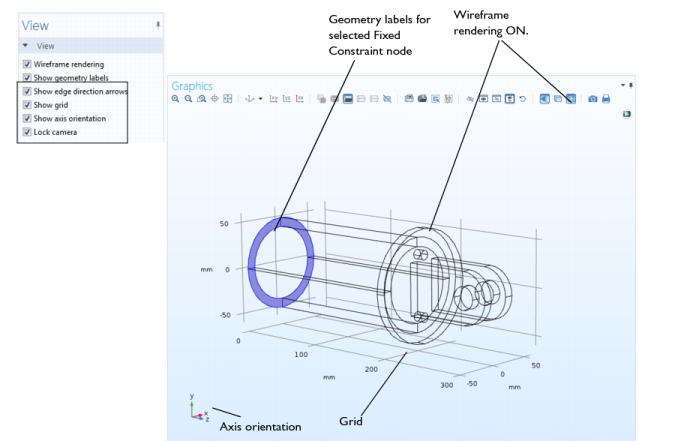
Select the Wireframe rendering check box to view the edges of the object as solid lines. The Wireframe Rendering button () is turned on or off in the Graphics window at the same time. Wireframe rendering only has effect when mesh rendering is turned off (for a view that normally shows the mesh).
Select the Show geometry labels check box to display the geometric object names and geometric entity labels (numbers) in the Graphics window. The labels appear for geometry objects or geometric entities (domain, boundary, edge, or point numbers), depending on what part of the model tree you display and the selection mode you are using.
Select the Show edge direction arrows check box to display direction arrows on edges in the Graphics window. The direction arrows indicate the directions for which the edge parameterization values increase.
By default, the Show grid check box is selected and displays a numbered grid in the Graphics window around the object. Click to clear the check box to hide the grid.
By default, the Mesh rendering check box is selected. Clear it to not render the mesh, where the mesh normally appears, which can be useful, for example, to get a better view of the inside of complex meshed 3D geometries. This check box is not available in geometry part views and result views.
By default, the Show axis orientation check box is selected and the axis orientation indicator for the global Cartesian coordinate directions is displayed in the lower-left corner of the Graphics window. Click to clear the check box to hide the axis orientation indicator.
Select the Lock camera check box to store the current camera settings so that the zoom tools can temporarily be used, for example, but then revisiting the View node restores the camera settings to the values in the view at the time the Lock camera check box was selected.
Light
The Scene light setting is a default that always displays and is based on the geometry. The Scene light, Diffuse light, Specular light, and Ambient light check boxes are selected by default. To hide and disable all light sources, click to clear the Scene light check box. The Scene Light button () is turned on or off in the Graphics window at the same time.
Click to clear the Diffuse light, Specular light, and Ambient light check boxes as needed.
Enter a value between 0 and 1 for the Ambient intensity (default value: 0.3) or use the slider to select a level. Watch the changes in the Graphics window at the same time to help choose a level.
Select a Color from the list: Custom, Black, Blue, Cyan, Gray, Green, Magenta, Red, White (default), or Yellow. The color is only applied to ambient light. If you select Custom, click the Color button to choose a color from the Custom color palette.
Transparency
Select the Transparency check box to turn on transparency. The Transparency button () is activated in the Graphics window at the same time. Enter a value between 0 and 1 in the Alpha field for the alpha blending, where 0 means a fully transparent color and 1 means a fully opaque color, or use the slider to select a transparency level. Watch the changes in the Graphics window at the same time to help choose a level.
Units
Clear the Show axis units check box if you do not want to include units for the plot axes.