|
1
|
|
3
|
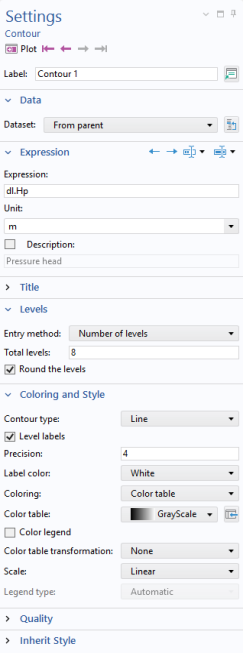
In the Model Builder, under Results click Pressure, 3D. In the Settings window for the 3D Plot Group type Pressure Head, 3D (dl)in the Label text field.
|
|
7
|
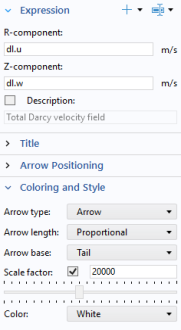
In the Settings window, verify that dl.u and dl.w are the expressions in the R- and Z- component text fields.
|
|
3
|
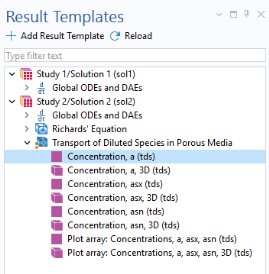
In the Model Builder under Results click on the Concentration, a (tds) node. In the Settings window, type Concentration comparison in the Label text field.
|
|
11
|
In the Settings window of Surface 2 locate the Expression section and type c_asx in the Expression test field.
|
|
13
|
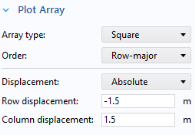
From the Displacement list choose Absolute. In the Row displacement field type -1.5[m], and in the Column displacement field, type 1.5[m]. The negative value ensures that the earliest time step is plotted on the top of the plot group.
|