Results
The default plot shows the solution for the last parameter value (160[deg]). You can easily change the parameter value to compare solutions for different load cases.
Stress (solid)
1
2
3
Repeat this and choose 130. Click Plot .
The stress distribution when at the angle 130 degrees is shown below.
Now, create a plot showing how the reaction forces at one of the bolt locations vary with the load angle.
Force in Bolt 1
1
2
Surface Integration 1
3
4
5
6
7
Table Graph 1
1
2
3
4
5
6
In the Settings window for 1D Plot Group, type Force in Bolt 1 in the Label text field.
Finally, add a plot showing how the stress varies as function of the load angle for some potentially critical points in the fillets.
Stress as Function of Load Angle
1
2
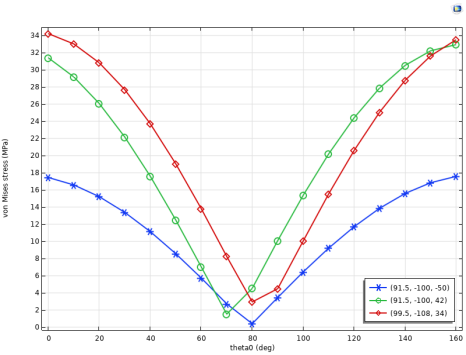
In the Settings window for 1D Plot Group, type Stress as Function of Load Angle in the Label text field.
3
4
5
6
7
8
9
Annotate the graphs by the location of each point.
10
11
12
In the Legend text field, type (eval(X,mm), eval(Y,mm), eval(Z,mm)).
13
Modeling Techniques for Structural Mechanics
The next set of tutorials build on the previous examples to demonstrate the following structural mechanics modeling techniques: How can I model thermal stress? How can I add an initial strain to the simulation? To get started, go to Including Initial Strain or Modeling Thermal Expansion.