Results
The default plot displays the von Mises stress distribution together with an exaggerated (automatically scaled) picture of the deformation.
Set default units for result presentation.
Preferred Units
1
2
3
4
5
6
7
8
9
10
11
12
Stress (solid)
1
2
3
In structural mechanics models, it is common with high stresses at singular boundary conditions. Here, this is the case at the bolt holes. In order to visualize the interesting parts of the stress distribution better, it is often useful to truncate the value range in plots.
4
5
Now, enhance the plot with load arrows. The easiest way of doing that is to copy from the predefined load plot, and then adapt the arrow plot slightly.
1
2
3
4
5
6
7
8
9
10
11
12
13
Total Displacement
Add a plot showing the displacement of the bracket. This is another one of the plots available under Result Templates.
1
2
3
4
5
Marker 1
Add a marker indicating the position of the maximum displacement.
1
2
3
4
Displacement (solid)
1
2
3
4
You may have noticed that in the plot group, the stresses and displacements are displayed as volume plots. It would also have been possible to use surface plots. For a solid geometry in 3D, the visual difference is small. Each of these plots have their merits, though. In a large model, a volume plot can take noticeably longer time to generate, since the expression to be visualized is evaluated not only on the surface, but also in the interior. If you want to plot only parts of the structure, the volume plot is easier to work with, since you can select domains, rather than boundaries. Also, for some expressions, an evaluation in the domain is more accurate than when the same expression is evaluated only on the boundaries.
Principal Stress
Create another plot to display the principal stresses.
1
2
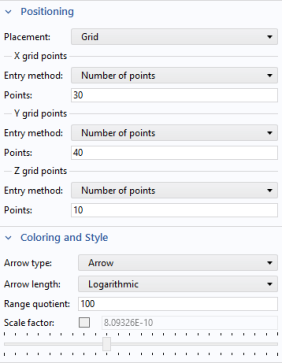
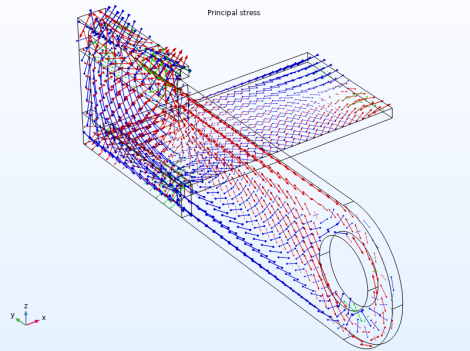
In the Settings window for 3D Plot Group, type Principal Stress in the Label text field.
3
4
5
Principal Stress Volume 1
1
2
-
-
-
3
4
The principal stresses are color coded so that red represents the first principal stress, green the second, and blue the third.
Stress Along Fillet
Plot the stress distribution along one of the fillets having high stress levels.
1
2
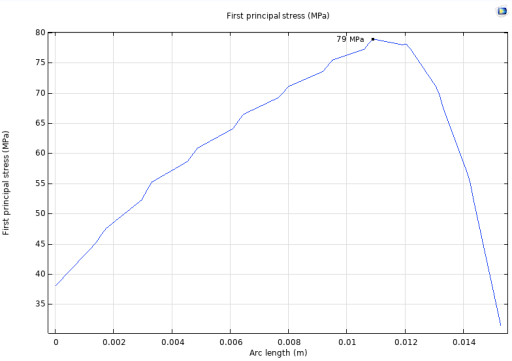
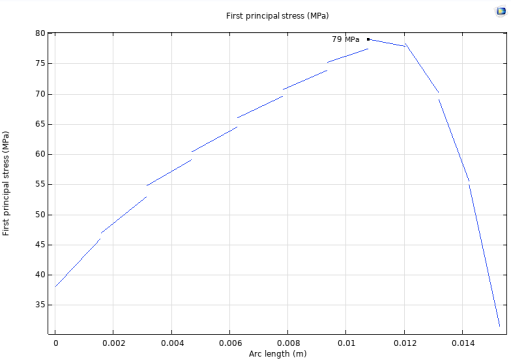
In the Settings window for 1D Plot Group, type Stress Along Fillet in the Label text field.
3
4
5
6
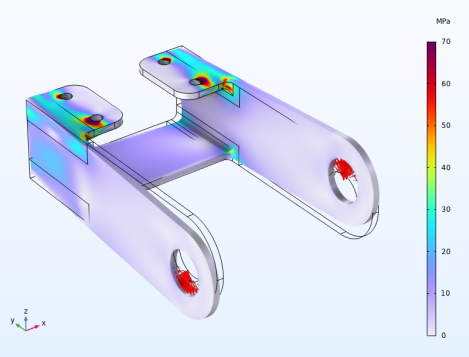
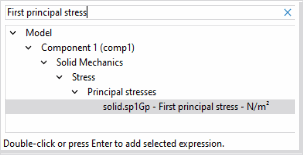
In the filter text field type First principal stress, then choose solid.sp1Gp - First principal stress - N/m².
7
8
9
10
11
12
13
You can get an indication of the discretization errors by switching off the averaging between adjacent elements.
14
15
16
17
18