Results
Each physics interface has a set of default plots that are generated when a study is run. In this case, it is a stress plot. All stresses are zero as initial value.
There are also a number of predefined result templates which can be added if needed. The applied loads are available as such a result template.
Add Result Template
1
In the Home toolbar, click Result Templates
.
2
Go to the Result Templates window.
3
In the tree, select Boundary Loads (solid).
4
Click Add Result Template
in the window toolbar.
5
In the Home toolbar, click Result Templates
again to hide the Result Templates window.
Boundary Loads (solid)
1
In the Boundary Loads (solid) toolbar, click Plot
. This step may not be necessary, depending on your settings for automatic update of plots in the Results node.
2
In the Model Builder window, expand the Boundary Loads (solid) node, then click Boundary Load 1.
3
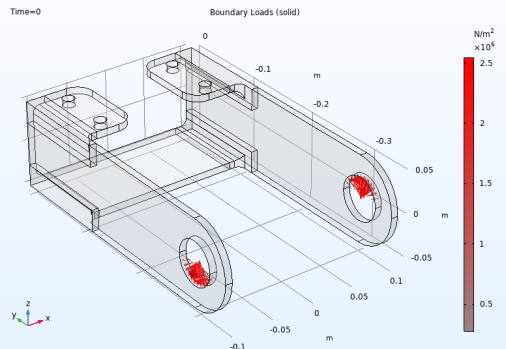
In the Settings window for Arrow Surface, locate the Coloring and Style section. Then, select the Scale factor checkbox, and enter
1E-8
in the associated text field.
From the Graphics window you can now check that the applied loads have the intended distributions and magnitudes.