Results
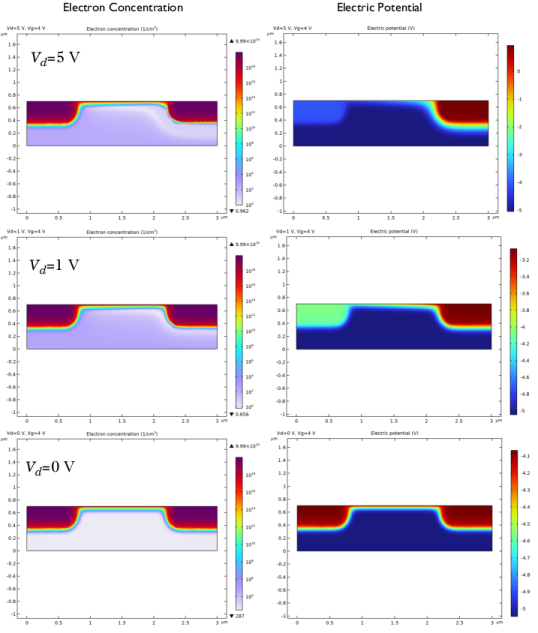
By looking at the electron concentration at Vd values of 0, 1, and 5 V the pinch-off of the channel can be clearly seen.
Electron Concentration (semi)
1
In the Model Builder under Results, click Electron Concentration (semi)
.
By default the plot shows the results for the case Vg=4 V and Vd=5 V.
2
In the Settings window for 2D Plot Group locate the Data section. Change the Vd Parameter value to 1 V and then to 0 V, each time selecting the Plot button
to see how the results change.
Electric Potential (semi)
1
In the Model Builder under Results, click Electric Potential (semi)
.
2
Look at the plot for Vd values of 5 V, 1 V and 0 V.
The plots in
Figure 10
show the results. The pinch off effect is apparent at 5 V.
Figure 10:
Electron concentration and electric potential distribution at Vd values of 0, 1, and 5 V. The pinch-off of the channel is apparent at 5 V.
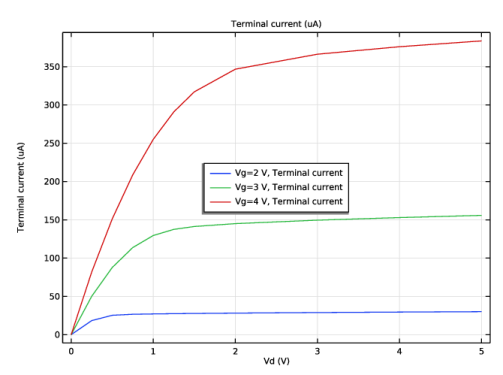
Add another 1D plot group to plot the drain current versus the drain voltage.
3
On the Home ribbon/toolbar select Add Plot Group
, and choose 1D Plot Group
.
4
Rename the plot group by typing “Id vs. Vd” in the Label field.
5
In the Settings window for 1D Plot Group locate the Data section. From the “Dataset” list, choose Study 2/Solution 2.
1D Plot Group 6
1
From the “Id vs. Vd” ribbon/toolbar click Global
.
2
In the Model Builder under Results > Id vs. Vd, click Global 1
.
3
In the Settings window for Global click Replace Expression
in the upper-right corner of the “y-Axis Data” section. In the menu, expand the tree to Model > Component1 > Semiconductor > Terminals, and then double click “semi.I0_2 - Terminal Current - A”.
4
Change the Unit to uA for the current.
5
Click the Plot button
.
The drain current versus drain voltage diagram shows a linear region for low bias, followed by a nonlinear region. The drain current increases slightly with voltage in the saturation region at higher drain voltages, as a result of short channel effects. Short channel effects mean that the standard analytic expressions for the saturation voltage and current do not apply, but the saturation voltages and currents are of a similar magnitude to those predicted by the simple theory (S.M. Sze and K.K. Ng,
Physics of Semiconductor Devices
, Wiley, Hoboken, New Jersey, pp. 305–306, 2007).