Results
2D Plot Group 1
Add a 2D plot group to check the dopant distribution in the model.
1
On the Home ribbon/toolbar click Add Plot Group
and choose 2D Plot Group
.
2
Rename the Plot Group by typing “Signed Dopant Concentration” in the Label field.
3
On the Signed Dopant Concentration ribbon/toolbar click Surface
.
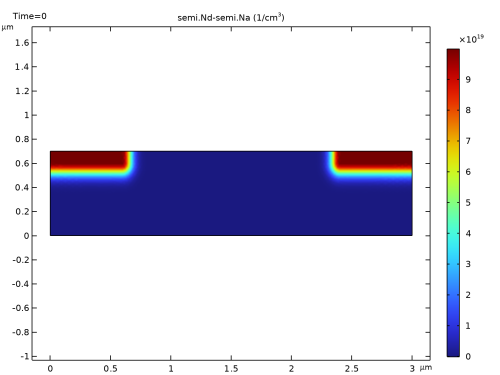
Plot the signed dopant concentration (Nd–Na). This quantity is positive for net donor doping and negative for net acceptor doping.
4
In the Model Builder under Results > Signed Dopant Concentration, click Surface 1
.
5
In the Settings window for Surface, locate the Expression section. In the Expression text field, type
semi.Nd-semi.Na
.
6
Change the Unit field under Expression from 1/m^3 to 1/cm^3
7
Click the Plot button
.
The doping distribution is shown below.