Results Analysis
The Ray Optics Module provides dedicated results analysis tools for visualizing ray propagation and extracting quantitative data. Two of the more specialized plot types, the Spot Diagram and Optical Aberration plots, are described here.
Spot Diagram Plot
The Spot Diagram plot displays the intersection points of rays with a surface. This surface could either be a physical boundary that absorbs the rays, or it could be a nongeometric entity like an intersecting plane defined during postprocessing.
Optionally, the rays can be filtered by release feature, wavelength, or number of reflections. You can also hide certain rays from the spot diagram by writing custom expressions. You can then display all rays as a single spot, or generate an array of spots, either sorting the rays by wavelength or by ray release feature.
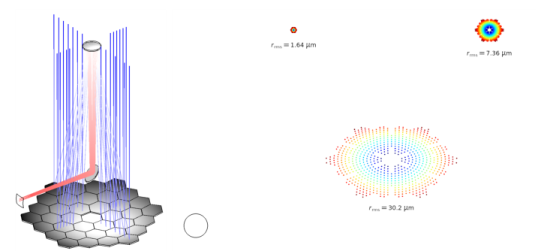
Keck telescope (left). Spot diagrams for three different field angles (right) with the RMS spot size shown below each spot. The Airy disk in the bottom-left corner is shown for scale.
The Spot Diagram plot also includes tools to automatically locate the plane of best focus, by locating the intersecting plane where the RMS spot size is minimized. This plane is automatically stored as an Intersection Point 3D dataset for future use. By using this functionality together with the settings to filter rays, you can locate the plane of best focus for specific wavelengths or specific field angles.
You can use other built-in settings to display the RMS spot size, position, or wavelength as text annotations that appear alongside each spot in the array. These annotations provide valuable quantitative data alongside the spot visualization. It is also possible to enter custom expressions for the color and size of the points rendered in the plot.
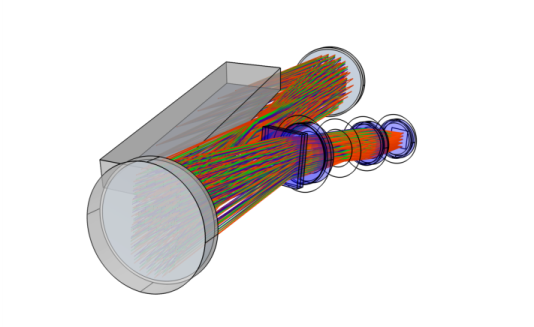
Ray diagram of a white pupil échelle spectrograph, which uses a combination of an échelle grating operated at high order and a cross dispersion grating operated at low order to separate light by wavelength. The light is then focused by a Petzval lens.
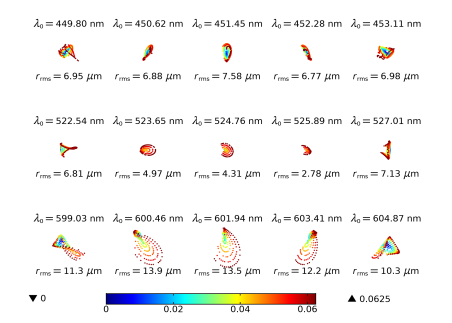
Spot diagrams for each wavelength. The color is the radial distance from each spot’s center.
Optical Aberration Plot
The Ray Optics Module can be used to investigate monochromatic aberrations in a lens system. To do so, use the Optical Aberration plot or the Aberration Evaluation feature. These features compute the wavefront error for the rays that are focused by a system of lenses and mirrors, then expresses the wavefront error as a linear combination of Zernike polynomials.
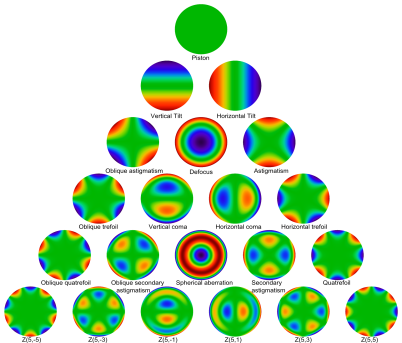
The Zernike polynomials, a standard orthogonal polynomial basis that is often used to describe monochromatic aberrations.
The Zernike coefficient calculation requires an Intersection Point 3D dataset to be created in the focal plane, with a hemispherical intersecting surface centered around the nominal optical axis. The Optical Aberration plot has features to automatically set up such an Intersection Point 3D dataset at the location of minimum RMS spot size.