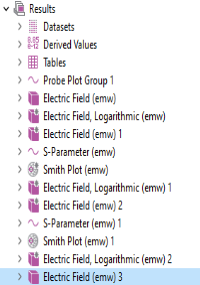
Results
1
In the Model Builder under Results, click Electric Field (emw) 3
.
2
Go to the Settings window for 3D Plot Group. Under Plot Settings from the View list, choose View 3.
3
Click the Plot
button.
Next, delete the multislice and create a single slice.
1
In the Model Builder window, expand Electric Field (emw) 3 node, right-click Multislice 1
and choose Delete
(or press Delete on the keyboard).
2
Click Delete.
3
Click Electric Field (emw) 3
. On the Electric Field toolbar click Slice
.
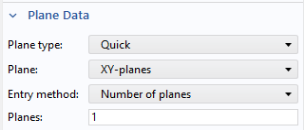
4
In the Settings window for Slice under Plane data from the Plane list, choose xy-planes. In the Planes text field, enter 1
5
Under Coloring and Style, choose Avicularia in Natural category from the Color table.
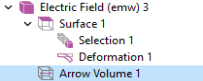
Add a deformation proportional to the electric field to the slice.
1
Right-click Slice 1
and choose Deformation
.
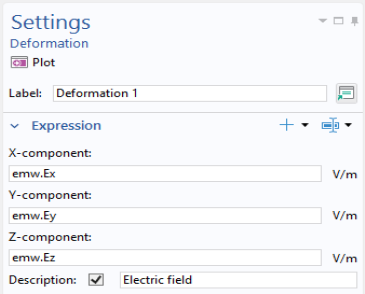
2
Go to the Settings window for Deformation. In the upper-right corner of the Expression section, click Replace Expression
. From the menu, choose Electromagnetic Waves, Frequency Domain > Electric > Electric field (emw.Ex,emw.Ey,emw.Ez).
3
Under Expression select the Description checkbox.
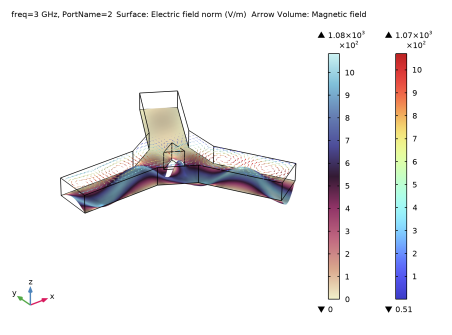
Display the magnetic field as arrows. Use logarithmic length scaling to make sure that the arrows are clearly visible everywhere. Place the arrows well above the slice.
1
In the Model Builder, right-click Electric Field (emw) 3
and choose Arrow Volume
.
2
Go to the Settings window for Arrow Volume. Click Replace Expression
.
3
From the menu, choose Electromagnetic Waves, Frequency Domain > Magnetic > Magnetic field (emw.Hx,emw.Hy,emw.Hz).
4
Under Expression select the Description checkbox.
5
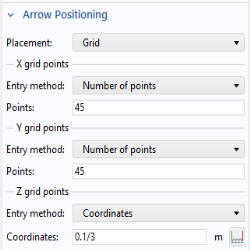
Under Arrow Positioning:
-
In the Points text field for x grid points, enter
45
.
-
In the Points text field for y grid points, enter
45.
-
For z grid points from the Entry method list, select Coordinates.
-
For z grid points in the Coordinates text field, enter
0.1/3
.
6
Right-click Arrow Volume
and choose Color Expression
.
7
In the Expression text field, type
emw.normE
.
The port excitation can now be selected for the plot group. For the model thumbnail, select the second port.
1
In the Model Builder click Electric Field (emw) 3
.
2
In the Settings window for 3D Plot Group under Data, choose 2 from the Parameter value (PortName) list.
3
Click the Plot
button.
Select this plot to use as a model thumbnail.
1
In the Model Builder under Results, click Electric Field (emw) 3
.
2
Click the Root node (the first node in the model tree). In the Settings window for Root, under Presentation, click Set from Graphics Window.
This concludes the modeling session unless you want to practice drawing the “Geometry Sequence”, which continues below.