Results
The probe with the reflection coefficient versus the frequency is automatically logged to a table and plotted while solving. At the last frequency, there are pronounced standing waves. Look at the center frequency instead.
1
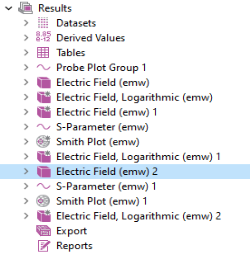
In the Model Builder under Results, click Electric Field (emw) 2
.
2
Go to the Settings window for 3D Plot Group. Under Data from the Parameter value (freq (GHz)) list, select
3
.
3
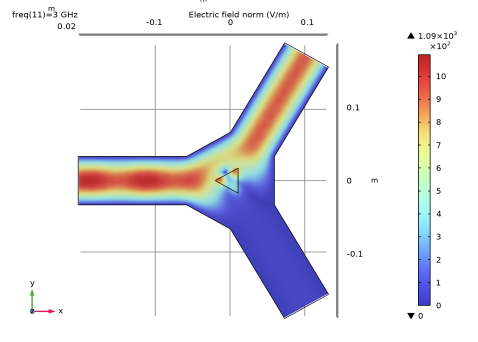
Click the Plot
button. Click the Go to XY View button
.
At the center frequency most of the standing waves are gone.
S-parameter (emw) 1
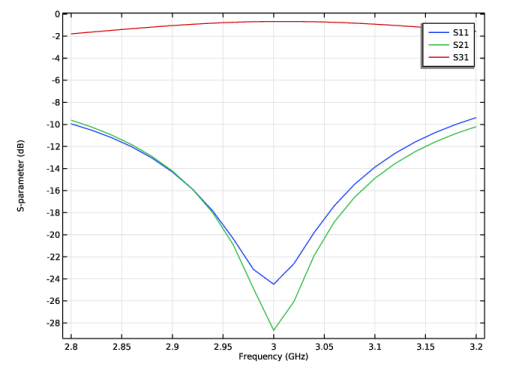
Finally look at all the S-parameters plotted versus the frequency. Go to the Global 1 plot in the S-Parameter (emw) 1 plot group.
emw.S11dB
,
emw.S21dB
, and
emw.S31dB
are plotted by default.
This is the frequency response of the final design.
 .
. 
 button. Click the Go to XY View button
  .
.