|
1
|
|
1
|
In the Settings window for 2D Plot Group, type Isothermal Contours & Velocity Streamlines in the Label text field
|
|
2
|
In the Settings window for Color Expression, locate the Expression section and type p in the Expression text field.
|
|
2
|
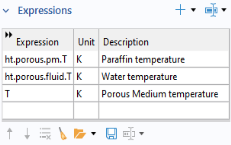
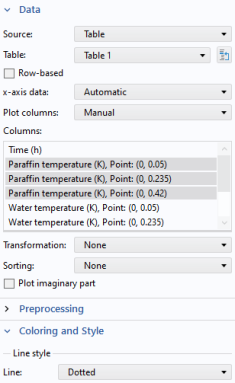
In the Settings window for Cut Point 2D, locate the Point Data section. In the r text field type 0, and in the z text field type 0.05 0.47/2 0.42. These points will evaluate temperatures in the packed bed at three different positions along the symmetry axis.
|
|
2
|
|
3
|
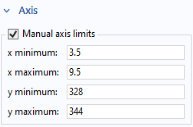
Locate the Axis section and select the Manual axis limits checkbox. In the x minimum text field, type 3.5, and in the x maximum text field type 9. This zooms into the time range between 3.5 and 9 hours. In the y minimum text field type 328, and in the y maximum text field type 344. to adjust the temperature range.
 |
|
3
|
|
4
|
In the toolbar, click Plot
|
|
3
|
In the Settings window for
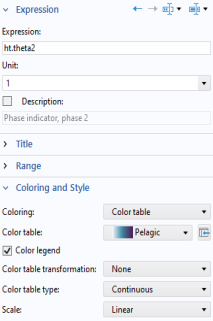 Volume enter ht.theta2 in the Expression text field. This is the name of the variable for the phase indicator of phase 2. To find these expressions, click Replace Expression Volume enter ht.theta2 in the Expression text field. This is the name of the variable for the phase indicator of phase 2. To find these expressions, click Replace Expression |
|
5
|
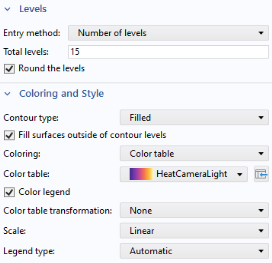
Click to expand the Range section. Select the Manual color range checkbox and type 1 in the Maximum text field.
|
|
2
|
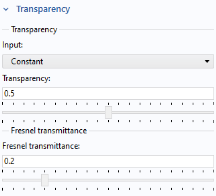
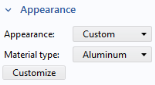
In the Settings window, type 0.2 in the Fresnel transmittance text field.
|
|
2
|
In the Settings window for 3D Plot Group, type Liquid Phase in the Label text field.
|
|
4
|
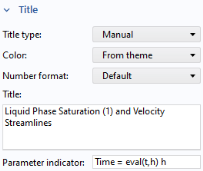
In the Title text area, type Liquid Phase Saturation (1) and Velocity Streamlines.
|
|
5
|
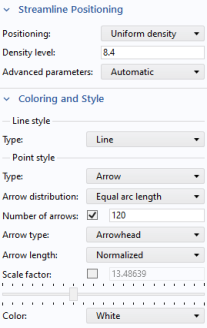
In the Parameter indicator text field, type Time = eval(t,h) h to update the title with the correct time automatically.
|