View the Results
The default plot groups show the pressure, velocity, and temperature in the pipe system.
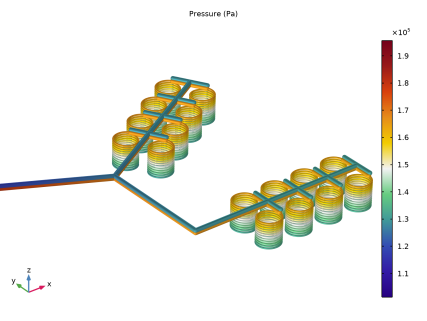
Pressure
To get a better view, do as follows:
1
Click the Zoom Box
button in the Graphics toolbar.
2
Draw a box in the Graphics window to zoom in on the two coil packages.
Temperature
The following instructions reproduce plot
Figure 14
:
1
Expand the Temperature node, then click Line 1.
2
In the Settings window for Line, locate the Expression section. From the Unit list, choose degC.
3
Click the Plot button
.
Reproduce the Reynolds number plot in
Figure 15
with the following steps.
Reynolds’ number
1
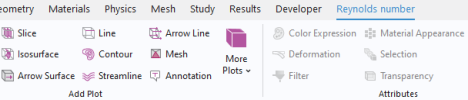
In the Results toolbar click 3D Plot Group
. In the Settings window for 3D Plot Group, type Reynolds’ number in the Label text field.
2
When the Reynolds’ number is selected in the Toolbar, an additional toolbar containing Plot Tools for the 3D Plot Group displays. On the Reynolds number toolbar, click Line
.
3
In the Settings window for Line, click Replace Expression
in the upper-right corner of the Expression section.
4
From the menu under Nonisothermal Pipe Flow, double-click Reynolds number (nipfl.Re).
5
Locate the Coloring and Style section. From the Line type list, choose Tube.
6
Click the Plot button
.
Note:
In this model, the bend features at the pipe corners are intentionally omitted, under the assumption that their influence on the results is negligible. As an exercise, bend point features may be added to verify the validity of this assumption.