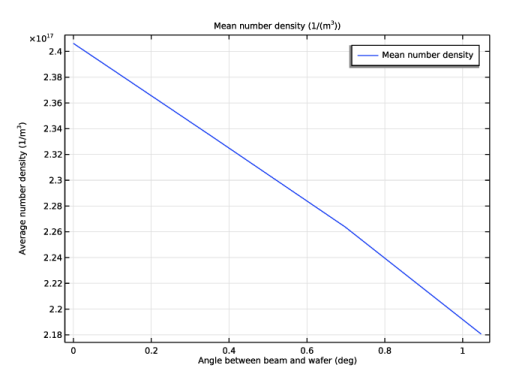
Results
Create a duplicate Solution dataset with a selection so that you can see inside the vacuum chamber.
Datasets
1
2
3
4
5
Incident Molecular Flux (fmf)
Update the default plots to use the new dataset.
1
2
Number Density (fmf)
1
2
Pressure (fmf)
1
2
Number Density (fmf)
1
2
3
4
The shadowing effect of the wafer support is evident at both wafer angles. It is also clear that more flux enters the beam line when the wafer normal is parallel to the beam. This is because the angular distribution of diffusely emitted flux is maximal parallel to the wafer normal.
1D Plot Group 4
Create a plot of the number density along the beam path.
1
2
3
4
5
6
7
8
9
The number density increases along the beam path toward the wafer, with strong changes in gradient as the beam passes through different apertures. Note that, in the immediate vicinity of the wafer, the number density is not computed accurately (this is difficult to see from the plot above, but zooming into the plot at the end of the beam makes it more apparent). This is a result of numerical issues when computing the number density very close to a source surface within the domain.
1D Plot Group 5
Finally, plot the mean number density along the beam line, as a function of wafer angle. This quantity can be used as figure of merit for the system design.
1
2
3
-
-
4
5
6
-
-
7
The average flux in the corrector is reduced by rotating the wafer normal away from the beam line with nearly a 10% reduction occurring over the full angular range. Rotating the wafer in this manner can therefore result in improved performance of the implanter.