|

|
1.793·10-3 Pa·s
|
||
|
1
|
|
2
|
In the Select Physics tree, select Fluid Flow > Porous Media and Subsurface Flow > Darcy’s Law (dl).
|
|
3
|
Right-click and choose Add Physics.
|
|
4
|
In the Select Physics tree, select Heat Transfer > Porous Media > Heat Transfer in Porous Media (ht).
|
|
5
|
Right-click and choose Add Physics.
|
|
6
|
Click
|
|
7
|
|
8
|
Click
|
|
1
|
|
2
|
|
3
|
Click
|
|
4
|
Browse to the model’s Application Libraries folder and double-click the file frozen_inclusion_parameters.txt.
|
|
1
|
|
2
|
|
3
|
|
4
|
|
1
|
|
2
|
|
3
|
|
4
|
|
5
|
|
6
|
|
7
|
|
8
|
|
1
|
In the Model Builder window, under Component 1 (comp1) right-click Materials and choose Blank Material.
|
|
2
|
|
1
|
|
2
|
|
1
|
|
2
|
|
1
|
|
2
|
|
3
|
|
4
|
|
1
|
|
2
|
|
3
|
|
1
|
|
2
|
|
3
|
|
4
|
|
1
|
|
2
|
|
3
|
|
4
|
|
1
|
|
2
|
|
3
|
|
1
|
In the Model Builder window, under Component 1 (comp1) > Heat Transfer in Porous Media (ht) > Porous Medium 1 click Porous Matrix 1.
|
|
2
|
|
3
|
From the Define list, choose Solid phase properties, because the properties of a pure solid material are given.
|
|
1
|
|
2
|
|
3
|
|
4
|
Locate the Heat Convection section. From the u list, choose Total Darcy velocity field (dl/porous1).
|
|
1
|
|
2
|
|
3
|
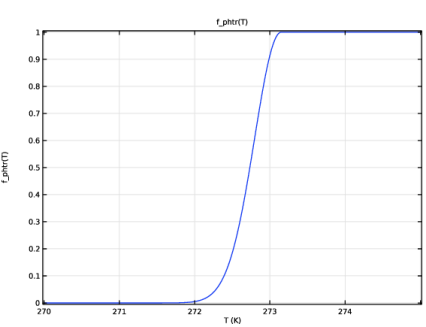
Locate the Phase Change section. From the Phase transition function list, choose User defined. In the α1 → 2 text field, type f_phtr(T).
|
|
4
|
|
5
|
|
6
|
|
1
|
|
2
|
|
1
|
|
2
|
|
3
|
|
4
|
Locate the Definition section. In the Expression text field, type exp(-((T-273.15)/W)^2)*(T<273.15)+1*(T>=273.15).
|
|
5
|
|
6
|
Locate the Units section. In the table, enter the following settings:
|
|
7
|
Locate the Plot Parameters section. In the table, enter the following settings:
|
|
8
|
|
1
|
In the Model Builder window, under Component 1 (comp1) > Heat Transfer in Porous Media (ht) click Initial Values 1.
|
|
2
|
|
3
|
|
1
|
|
3
|
|
4
|
|
1
|
|
3
|
|
4
|
|
1
|
|
1
|
|
1
|
In the Model Builder window, under Component 1 (comp1) right-click Definitions and choose Variables.
|
|
2
|
|
1
|
|
2
|
|
3
|
|
1
|
|
2
|
|
3
|
|
1
|
|
2
|
|
3
|
|
1
|
|
2
|
|
3
|
|
4
|
|
1
|
|
3
|
|
4
|
|
1
|
|
1
|
|
1
|
|
2
|
|
1
|
|
2
|
|
1
|
|
2
|
|
1
|
|
2
|
|
1
|
|
2
|
|
3
|
|
1
|
|
2
|
|
3
|
Click the Custom button.
|
|
4
|
Locate the Element Size Parameters section.
|
|
5
|
|
6
|
Click
|
|
1
|
|
2
|
|
3
|
|
1
|
|
2
|
|
3
|
In the Solve for column of the table, under Component 1 (comp1), clear the checkbox for Heat Transfer in Porous Media (ht).
|
|
4
|
|
1
|
|
2
|
|
3
|
|
4
|
In the Output times text field, type range(0,5,60)[min] range(1.5,0.5,18) range(18.1,0.025,22) range(22.5,0.5,28) range(29,1,56).
|
|
5
|
|
6
|
|
1
|
|
2
|
|
3
|
|
4
|
From the Steps taken by solver list, choose Strict This ensures that the time step cannot be bigger than the output intervals. However, it can still be smaller if necessary.
|
|
5
|
|
1
|
|
2
|
|
3
|
|
4
|
|
5
|
|
6
|
|
7
|
Click to expand the Advanced section. Find the Space variables subsection. Select the Remove elements on the symmetry axis checkbox.
|
|
1
|
|
2
|
|
3
|
|
4
|
|
1
|
|
2
|
|
3
|
|
4
|
|
5
|
|
6
|
|
1
|
|
2
|
Go to the Result Templates window.
|
|
3
|
|
4
|
Click the Add Result Template button in the window toolbar.
|
|
5
|
|
1
|
|
2
|
|
3
|
|
1
|
|
2
|
|
3
|
|
4
|
|
1
|
|
2
|
|
3
|
|
4
|
|
1
|
|
2
|
|
3
|
|
4
|
|
5
|
|
6
|
|
7
|
|
8
|
|
1
|
|
2
|
|
3
|
|
4
|
Click Replace Expression in the upper-right corner of the Expressions section. From the menu, choose Component 1 (comp1) > Heat Transfer in Porous Media > Temperature > T - Temperature - K.
|
|
5
|
Locate the Expressions section. In the table, enter the following settings:
|
|
6
|
Click
|
|
1
|
Go to the Table 1 window.
|
|
2
|
Click the Table Graph button in the window toolbar.
|
|
1
|
|
2
|
|
1
|
|
3
|
In the Settings window for Line Integration, click Replace Expression in the upper-right corner of the Expressions section. From the menu, choose Component 1 (comp1) > Heat Transfer in Porous Media > Boundary fluxes > ht.ntflux - Normal total heat flux - W/m².
|
|
4
|
Locate the Expressions section. In the table, enter the following settings:
|
|
5
|
|
1
|
Go to the Table 2 window.
|
|
2
|
Click the Table Graph button in the window toolbar.
|
|
1
|
|
2
|
|
1
|
|
2
|
|
3
|
|
4
|
|
6
|
|
1
|
Go to the Table 3 window.
|
|
2
|
Click the Table Graph button in the window toolbar.
|
|
1
|
|
2
|