|
|
|
|
G’
|
||
|
G”
|


|
1
|
|
2
|
|
3
|
Click Add.
|
|
4
|
Click
|
|
5
|
|
6
|
Click
|
|
1
|
|
2
|
|
3
|
Click
|
|
4
|
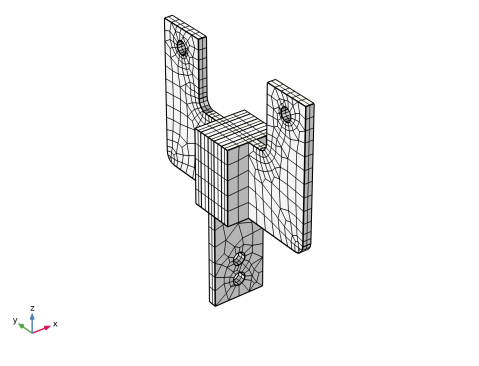
Browse to the model’s Application Libraries folder and double-click the file viscoelastic_damper_eigenmodes_parameters.txt.
|
|
1
|
|
2
|
|
3
|
|
4
|
|
5
|
|
7
|
Click to expand the Advanced section. Select the May produce complex output for real arguments checkbox.
|
|
8
|
Locate the Plot Parameters section. In the table, enter the following settings:
|
|
1
|
|
2
|
|
3
|
|
1
|
|
2
|
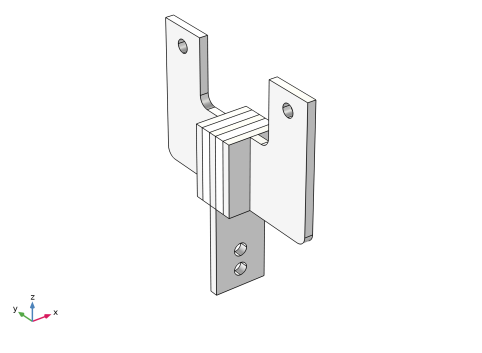
Browse to the model’s Application Libraries folder and double-click the file viscoelastic_damper_geom_sequence.mph.
|
|
3
|
|
4
|
|
1
|
|
2
|
|
3
|
|
4
|
|
1
|
|
2
|
|
3
|
|
4
|
|
5
|
|
1
|
|
2
|
Go to the Add Material window.
|
|
3
|
|
4
|
Click the Add to Component button in the window toolbar.
|
|
5
|
|
1
|
In the Model Builder window, under Component 1 (comp1) right-click Materials and choose Blank Material.
|
|
2
|
|
4
|
Locate the Material Contents section. In the table, enter the following settings:
|
|
5
|
|
6
|
In the Settings window for Materials, in the Graphics window toolbar, click
|
|
1
|
|
2
|
|
3
|
|
1
|
|
2
|
|
3
|
|
4
|
Locate the Prescribed Displacement section. From the Displacement in x direction list, choose Prescribed.
|
|
5
|
|
1
|
|
2
|
|
3
|
|
4
|
Locate the Prescribed Displacement section. From the Displacement in y direction list, choose Prescribed.
|
|
1
|
|
1
|
|
2
|
|
3
|
|
1
|
|
1
|
|
2
|
|
3
|
|
1
|
|
2
|
|
3
|
|
1
|
|
1
|
|
2
|
|
3
|
|
1
|
|
2
|
|
3
|
|
1
|
|
2
|
|
3
|
|
1
|
|
3
|
|
4
|
Click to select the
|
|
1
|
|
1
|
|
2
|
|
1
|
|
1
|
|
2
|
|
1
|
|
2
|
|
4
|
|
5
|
|
6
|
Click to expand the Coloring and Style section. Find the Line style subsection. From the Line list, choose None.
|
|
7
|
|
8
|
|
9
|
|
1
|
|
2
|
Go to the Add Study window.
|
|
3
|
|
4
|
Right-click and choose Add Study.
|
|
1
|
|
2
|
|
3
|
|
4
|
|
5
|
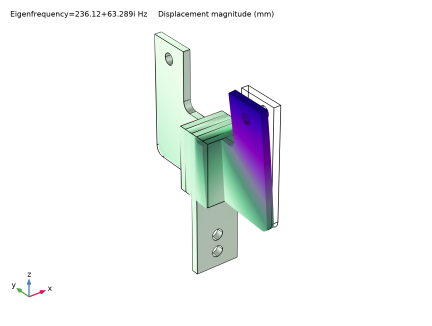
Find the Rectangle search region subsection. In the Smallest real part (Eigenfrequency) text field, type 200.
|
|
6
|
|
7
|
|
8
|
|
1
|
|
2
|
|
3
|
Select the x-axis label checkbox.
|
|
4
|
|
5
|
|
6
|
|
7
|
|
1
|
|
2
|
|
3
|
|
1
|
|
2
|
|
3
|
|
4
|
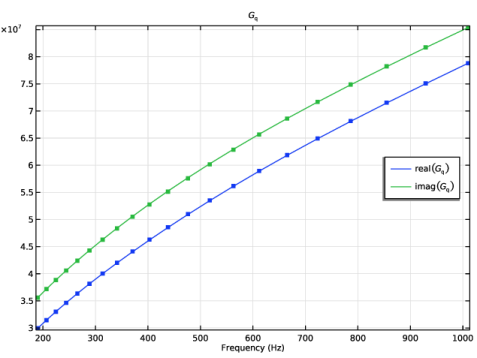
Locate the Legends section. In the table, enter the following settings:
|
|
5
|
|
1
|
In the Model Builder window, under Component 1 (comp1) > Solid Mechanics (solid) > Linear Elastic Material 2 right-click Viscoelasticity 1 and choose Duplicate.
|
|
2
|
|
3
|
Select the Low frequency limit checkbox.
|
|
4
|
Locate the Time Domain and Eigenfrequency section. From the Frequency range list, choose Minimum and maximum.
|
|
5
|
|
6
|
|
7
|
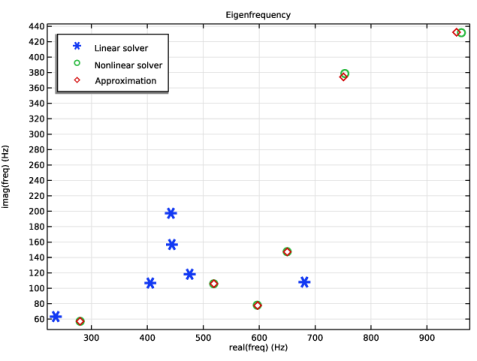
Click Approximation in the upper-right corner of the Time Domain and Eigenfrequency section. From the menu, choose Compute Approximation.
|
|
8
|
Click Section_bar in the upper-right corner of the Time Domain and Eigenfrequency section. From the menu, choose Preview Approximation.
|
|
9
|
Click Preview Approximation in the upper-right corner of the Time Domain and Eigenfrequency section. From the menu, choose Create Approximation Plot.
|
|
1
|
|
2
|
Go to the Add Study window.
|
|
3
|
|
4
|
Right-click and choose Add Study.
|
|
1
|
|
2
|
|
3
|
|
4
|
|
5
|
Locate the Physics and Variables Selection section. Select the Modify model configuration for study step checkbox.
|
|
6
|
In the tree, select Component 1 (comp1) > Solid Mechanics (solid) > Linear Elastic Material 2 > Viscoelasticity 1.
|
|
7
|
Right-click and choose Disable.
|
|
8
|
|
1
|
In the Model Builder window, under Results > Eigenfrequency right-click Global 2 and choose Duplicate.
|
|
2
|
|
3
|
|
4
|
Locate the Legends section. In the table, enter the following settings:
|
|
5
|