
|
|
|


|
1
|
|
2
|
In the Application Libraries window, select Semiconductor Module > Transistors > mosfet in the tree.
|
|
3
|
Click
|
|
1
|
|
2
|
|
1
|
|
2
|
|
1
|
|
2
|
|
1
|
|
2
|
|
3
|
|
4
|
|
5
|
|
6
|
Select the Cutoff checkbox.
|
|
7
|
|
8
|
Select the Size of transition zone at cutoff checkbox.
|
|
9
|
|
10
|
|
1
|
|
2
|
|
1
|
|
3
|
|
4
|
|
1
|
|
2
|
|
3
|
|
1
|
|
2
|
|
3
|
|
1
|
|
2
|
Go to the Add Study window.
|
|
3
|
|
4
|
Click the Add Study button in the window toolbar.
|
|
5
|
|
1
|
|
2
|
Select the Modify model configuration for study step checkbox.
|
|
3
|
|
4
|
Click
|
|
5
|
|
6
|
Click
|
|
1
|
|
2
|
|
3
|
In the Output times text field, type range(0,0.2/15,0.18)*1e-3 range(0.2,0.6/5,0.8)*1e-3 range(0.85,0.15/5,1)*1e-3.
|
|
4
|
Locate the Physics and Variables Selection section. Select the Modify model configuration for study step checkbox.
|
|
5
|
|
6
|
Click
|
|
1
|
|
2
|
|
3
|
In the Model Builder window, under Study 3 > Solver Configurations > Solution 3 (sol3) click Time-Dependent Solver 1.
|
|
4
|
|
5
|
|
6
|
|
7
|
|
8
|
Right-click Study 3 > Solver Configurations > Solution 3 (sol3) > Time-Dependent Solver 1 and choose Stop Condition.
|
|
9
|
|
10
|
|
11
|
|
13
|
|
14
|
|
15
|
Clear the Generate default plots checkbox.
|
|
16
|
|
1
|
|
2
|
|
3
|
|
4
|
Locate the Plot Settings section.
|
|
5
|
|
6
|
|
7
|
|
8
|
|
9
|
|
1
|
|
2
|
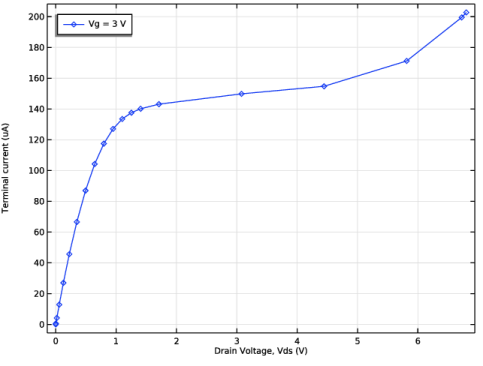
In the Settings window for Global, click Replace Expression in the upper-right corner of the y-Axis Data section. From the menu, choose Component 1 (comp1) > Semiconductor > Terminals > semi.I0_2 - Terminal current - A.
|
|
3
|
|
4
|
|
5
|
Locate the y-Axis Data section. In the table, enter the following settings:
|
|
6
|
|
8
|
Click to expand the Coloring and Style section. Find the Line markers subsection. From the Marker list, choose Diamond.
|
|
9
|
|
1
|
|
2
|
|
3
|
|
4
|
|
1
|
|
2
|
|
3
|
|
1
|
|
2
|
|
1
|
|
2
|
|
3
|
Click OK.
|
|
1
|
|
2
|
|
3
|
|
4
|
|
5
|
|
6
|