|
|
|

 and
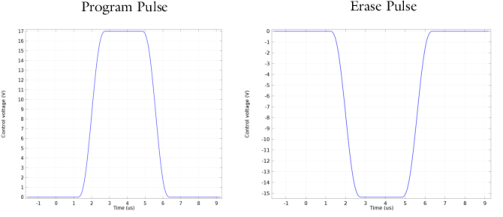
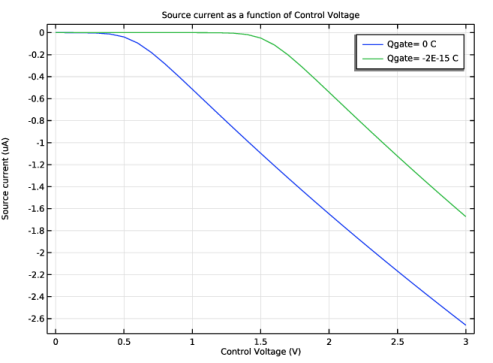
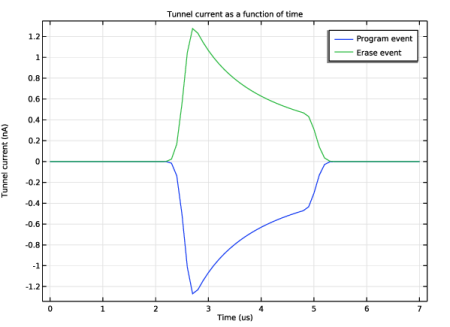
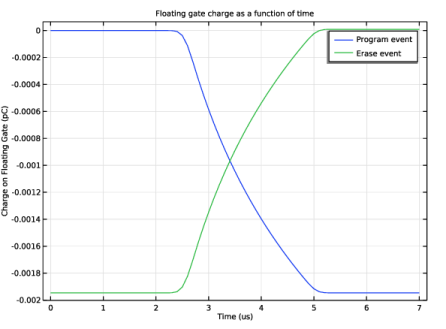
and  are constants related to the material properties of the insulator and semiconductor (see Ref. 1 for details). As current flows into the floating gate as a result of the applied field the charge on the gate builds up and this in turn acts to oppose the applied field. Thus the charging of the floating gate is a self-limiting process for a fixed applied bias, similar in nature to the charging of a capacitor through a resistor.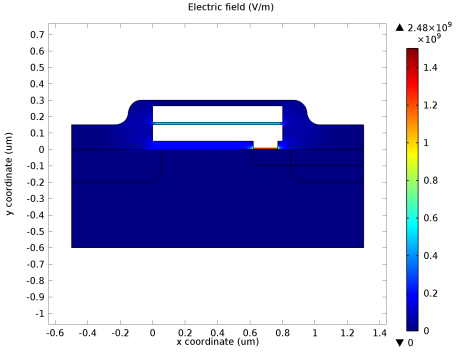
|
1
|
|
2
|
|
3
|
Click Add.
|
|
4
|
Click
 Study. Study. |
|
5
|
|
6
|
Click
 Done. Done. |
|
1
|
|
2
|
Browse to the model’s Application Libraries folder and double-click the file eeprom_geom_sequence.mph.
|
|
1
|
|
2
|
|
3
|
|
4
|
|
5
|
|
6
|
|
7
|
|
8
|
|
9
|
Click
 Build All Objects. Build All Objects. |
|
1
|
|
2
|
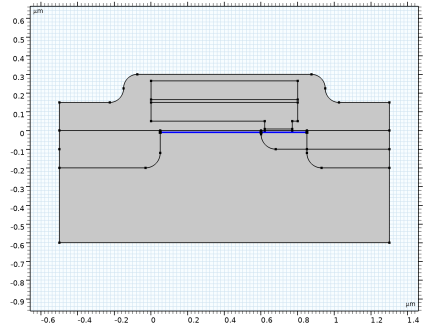
On the object fin, select Boundaries 18 and 22 only.
|
|
1
|
|
2
|
Go to the Add Material window.
|
|
3
|
|
4
|
Click the Add to Component button in the window toolbar.
|
|
1
|
In the Model Builder window, under Component 1 (comp1) right-click Materials and choose Blank Material.
|
|
3
|
|
5
|
|
1
|
|
2
|
|
1
|
|
2
|
|
3
|
|
4
|
|
5
|
|
1
|
|
2
|
|
4
|
|
1
|
|
2
|
|
3
|
|
1
|
|
1
|
|
2
|
|
3
|
|
1
|
|
3
|
|
4
|
|
5
|
|
1
|
|
3
|
|
4
|
|
5
|
|
6
|
|
7
|
|
1
|
In the Model Builder window, expand the Geometric Doping Model 1 node, then click Boundary Selection for Doping Profile 1.
|
|
1
|
|
3
|
|
4
|
|
5
|
|
1
|
|
3
|
|
4
|
|
5
|
|
6
|
|
7
|
|
1
|
In the Model Builder window, expand the Geometric Doping Model 2 node, then click Boundary Selection for Doping Profile 1.
|
|
1
|
|
3
|
|
1
|
|
3
|
|
1
|
|
3
|
|
4
|
|
5
|
|
1
|
|
3
|
|
4
|
|
5
|
|
6
|
|
1
|
|
3
|
|
4
|
|
5
|
|
6
|
|
1
|
|
3
|
|
4
|
|
5
|
|
6
|
|
7
|
|
1
|
|
3
|
|
4
|
|
5
|
|
6
|
|
7
|
|
1
|
|
3
|
|
4
|
|
5
|
|
1
|
|
2
|
|
3
|
|
5
|
|
1
|
|
2
|
|
3
|
|
5
|
|
6
|
|
1
|
|
2
|
|
3
|
|
5
|
|
6
|
Locate the Element Size Parameters section.
|
|
7
|
|
1
|
|
1
|
|
2
|
|
3
|
|
4
|
|
5
|
Click the Custom button.
|
|
6
|
Locate the Element Size Parameters section.
|
|
7
|
|
1
|
|
2
|
|
3
|
|
5
|
|
6
|
|
7
|
Click the Custom button.
|
|
8
|
Locate the Element Size Parameters section.
|
|
9
|
|
10
|
|
1
|
|
3
|
|
4
|
Click to select the
 Activate Selection toggle button. Activate Selection toggle button. |
|
1
|
|
3
|
|
4
|
Click to select the
 Activate Selection toggle button. Activate Selection toggle button. |
|
1
|
|
2
|
|
3
|
|
5
|
Click to expand the Control Entities section. From the Smooth across removed control entities list, choose Off.
|
|
6
|
|
1
|
|
3
|
|
4
|
|
5
|
|
6
|
|
7
|
|
1
|
|
1
|
|
2
|
|
3
|
|
5
|
Click to expand the Control Entities section. From the Smooth across removed control entities list, choose Off.
|
|
6
|
|
1
|
|
2
|
|
3
|
Clear the Generate default plots checkbox.
|
|
4
|
|
1
|
|
2
|
|
3
|
|
4
|
|
1
|
|
2
|
|
1
|
|
2
|
|
3
|
Select the Modify model configuration for study step checkbox.
|
|
4
|
|
5
|
Click
 Disable. Disable. |
|
6
|
|
7
|
Click
 Disable. Disable. |
|
8
|
|
9
|
Click
 Add. Add. |
|
11
|
Click
 Add. Add. |
|
13
|
|
14
|
|
1
|
|
2
|
|
3
|
|
4
|
|
5
|
In the Model Builder window, expand the Study 1 > Solver Configurations > Solution 1 (sol1) > Dependent Variables 1 node, then click Electron Solution Variable (comp1.Ne).
|
|
6
|
|
7
|
|
8
|
|
9
|
In the Model Builder window, under Study 1 > Solver Configurations > Solution 1 (sol1) > Dependent Variables 1 click Hole Solution Variable (comp1.Ph).
|
|
10
|
|
11
|
|
12
|
|
13
|
|
14
|
In the Settings window for Study, type Stationary, sweep Vcontrol for fixed Qgate. in the Label text field.
|
|
15
|
|
1
|
|
2
|
|
1
|
|
2
|
|
4
|
|
5
|
|
1
|
|
2
|
|
3
|
|
4
|
|
5
|
|
6
|
|
1
|
|
2
|
Go to the Add Study window.
|
|
3
|
|
4
|
Click the Add Study button in the window toolbar.
|
|
5
|
|
1
|
|
2
|
|
3
|
Click to expand the Values of Dependent Variables section. Find the Initial values of variables solved for subsection. From the Settings list, choose User controlled.
|
|
4
|
|
5
|
|
6
|
|
7
|
|
8
|
Click
 Add. Add. |
|
10
|
Click
 Add. Add. |
|
12
|
Click
 Add. Add. |
|
14
|
|
15
|
|
16
|
|
1
|
|
2
|
|
3
|
|
4
|
|
5
|
|
1
|
|
2
|
Go to the Add Study window.
|
|
3
|
|
4
|
Click the Add Study button in the window toolbar.
|
|
5
|
|
1
|
|
2
|
|
3
|
Locate the Values of Dependent Variables section. Find the Initial values of variables solved for subsection. From the Settings list, choose User controlled.
|
|
4
|
|
5
|
|
6
|
|
7
|
|
8
|
Click
 Add. Add. |
|
10
|
Click
 Add. Add. |
|
12
|
Click
 Add. Add. |
|
14
|
|
15
|
|
16
|
|
1
|
|
2
|
|
3
|
|
4
|
|
5
|
|
1
|
|
2
|
|
3
|
|
4
|
|
5
|
|
6
|
Locate the Plot Settings section.
|
|
7
|
|
8
|
|
1
|
|
2
|
|
3
|
|
4
|
Locate the y-Axis Data section. In the table, enter the following settings:
|
|
5
|
|
6
|
|
7
|
|
1
|
|
2
|
|
3
|
|
4
|
Locate the y-Axis Data section. In the table, enter the following settings:
|
|
5
|
|
6
|
|
7
|
|
9
|
|
1
|
|
2
|
|
3
|
|
4
|
|
5
|
|
6
|
Locate the Plot Settings section.
|
|
7
|
|
8
|
|
1
|
|
2
|
|
3
|
|
4
|
Locate the y-Axis Data section. In the table, enter the following settings:
|
|
5
|
|
6
|
|
7
|
|
1
|
|
2
|
|
3
|
|
4
|
Locate the Legends section. In the table, enter the following settings:
|
|
5
|
|
1
|
|
2
|
|
3
|
Click OK.
|