PDF

Model of an Argon/Oxygen Capacitively Coupled Plasma Reactor
Introduction
This tutorial models an argon/oxygen capacitively coupled plasma reactor in 1D. The goal is to show how to prepare a model with a mixture of different elements (in this case Ar and O2) in which one of the species can dissociate by electron impact (O2 dissociates into O) and where negative ions exist (the dissociative electron attachment of O2 creates O-).
A simplified plasma chemistry is used to discuss the main aspects of such discharges. It is important to keep in mind that a benchmark is not attempted and the idea is to provide a base case that can be used to develop more complex chemistries. In fact, it might be necessary to modify the data used and add more reactions to achieve experimental verification.
Model Definition
The model presented here is 1D and describes the space- and time-periodic evolution of several macroscopic properties of the plasma sustained within a 4.5 cm gap at 50 mTorr and for an absorbed power of 10 W. The electron mobility and other electron transport properties are automatically computed from the electron impact reactions.
Electric excitation
The driven electrode has a fixed power. This corresponds to the following expression and constraint on the electric potential:
(1)
(2).
The constraint in Equation 2 is used to compute the RF potential, Va such that a fixed amount of power is deposited into the plasma.
Plasma Chemistry
Negative ions are created in certain molecular gaseous discharges (like chlorine, oxygen, hydrogen, fluorocarbons, and so on) and these discharges tend to have complex plasma chemistries with many ions, dissociative products, and excited states. Here a simple plasma chemistry is used and no benchmark is attempted. In fact, it might be necessary to modify the data used and add more reactions to achieve experimental verification. Nevertheless, this plasma chemistry allows to show the main aspects of an electronegative discharge. The plasma chemistry for oxygen is based on the one presented in Ref. 1 (from the section “A Data Set for Oxygen”, page 270) but the electron impact reactions are mostly retrieved from Ref. 2 in the form of electron impact cross sections. A good discussion of the chemistry of an oxygen/argon plasma at low pressures can be found in Ref. 3.
Argon is one of the simplest mechanisms to implement at low pressures. The electronically excited states can be lumped into a single species, which results in a chemical mechanism consisting of only 3 species and 7 reactions presented in Table 1 (electron impact cross sections are obtained form Ref. 4).
Oxygen has a much richer reaction set that includes vibrational and rotational excitations, excitation of several electronic excited states, electron impact dissociation, dissociative attachment, and many others. Electron impact reactions with O2 are from Ref. 5 and electron impact reaction with O are from Ref. 6 except for e+O-=>O+e+e, which is from Ref. 1. The electron impact reactions used in this model are presented in Table 2. The following simplifications were made: 3-body attachment is not included, rotational and vibrational states are not treated explicitly but energy losses are considered, the dissociative excitation reaction at 14.7 eV is not included, polar dissociation is not included, reverse reaction by detailed balance are not included for O2 and O excited states. The only oxygen excited states that are solved explicitly are the singlet delta metastable of molecular oxygen O2(a1Δg) and the metastable state O(1D).
e+O2=>O+O-
e+O2=>e+O2
e+O2=>e+O2
e+O2=>e+O2
e+O2=>e+O2
e+O2=>e+O2
e+O2=>e+O2
e+O2=>e+O2
e+O2=>e+O2
e+O2=>e+O2(a1Δg)
e+O2=>e+O2
e+O2=>e+O2
e+O2=>e+O+O
e+O2=>e+O+O(1D)
e+O2=>e+O2
e+O2=>e+O2+
e+O-=>O+e+e
On Table 3 are presented heavy species reaction involving ions. For reaction 6 it is used the same rate constant as for reaction 2.
O++O2=>O+O2+
O++O-=>O+O
O-+O2+=>3O
O-+O2+=>O+O2
O-+O2=>O2+e
O-+Ar+=>O+Ar
In addition to volumetric reactions, the following surface reactions are implemented.
Ar+=>Ar
O2+=>O2
O-=>O
O2(a1Δg)=>O
O(1D)=>0.5O2
O+=>O
It is by using surface reactions that boundary conditions for heavy species are introduced in the model. If no surface reactions that leads to the lost of a given species at a surface are introduced in the model, that species will not have losses by transport. This can lead to the unbounded growth of a given species and in the case of the Plasma, Time Periodic interface means that a periodic steady state might not be possible.
Atomic recombination (reaction 3 in Table 4) at a surface is an important aspect of plasma discharges with molecular species since it influences the dissociation degree in the discharge. The sticking coefficient for atomic recombination is a function of the surface type and temperature.
Electronegative plasmas
Electronegative plasmas are plasmas that contain negative ions. Negative ions are mainly created by electron dissociative attachment (for example, e+O2=>O+O-). This reaction tends to be very effective at low electron energies and can reduce the electrons in a discharge to a point that an ion–ion discharge is obtained. The transport and volume creation/destruction mechanisms tend to be more complex than electropositive plasmas in many aspects. Here only a few are mentioned with emphasis on the numerical difficulties that they introduce. More information can be found in Ref. 1 section 10.3 and references therein.
In electronegative discharges negative ions are well confined by the ambipolar electric field and losses by transport are very small. This means that to achieve a steady state volume losses need to be included for negative ions. The mechanisms by which negative ions are lost depend on the gas mixture and pressure and they are: mutual recombination with positive ions (for example, O-+O+=>O+O or O-+Ar+=>O+Ar), detachment in collisions with excited or neutral atoms or molecules (for example, O-+O=>O2+e or O-+O2=>O+O2+e), and electron-impact detachment (for example, e+O-=>O+2e).
In electronegative discharges it is often possible to identify two spatial regions using the electronegativity (ratio of the negative ion density to the electron density): (i) one in the core of the discharge (the electronegative core) with high electronegativity where the dominant charge species are positive and negative ions; (ii) and the other close to the boundaries (electropositive edges) where the dominant charged species are electron and positive ions. In the transition between these two regions the negative ion density drops abruptly causing a chock-like phenomena. This transition needs to be well resolved spatially. If not, oscillations can be seen in the negative ion density and the model might not converge. Some strategies to deal with this are:
Increase the negative ion temperature of about 0.3 eV. An higher ion temperature makes the transport numerical easier. The ion temperature is defined in the section Mobility and Diffusivity Expressions in the species Settings. By default the ion temperature is the gas temperature.
Enable Isotropic diffusion for ions in the Inconsistent Stabilization section (the stabilization sections are visible when Stabilization is selected in Show More Options). This option adds artificial diffusion to all ions and helps smoothing the sharp transition of the negative ion density between the electropositive edge and the electronegative core, and also increase the density of the negative ions in the electropositive edge effectively increasing its losses by transport. This option should be used very carefully since completely wrong results can be obtained if too much diffusion is used (the tuning parameter for ions should not be larger than 0.1). A useful strategy is to start with a large Tuning parameter for ions (for example, 0.5) and ramp it down using an Auxiliary sweep.
Negative ions are well confined in the discharge core and can attain negligible densities in the edges. If the density becomes too low it can present a numerical problem. To overcome this difficulty it is necessary to add some artificial creation that can be achieved by enabling the Reaction source stabilization.
Inflow
When solving for plasmas with chemistries that contain more than one element (for example, Ar and O2) in the Plasma, Time Periodic interface the mass fraction of each element is not conserved if no constraint is used. This problem is similar in nature to the one found when solving for Navier-Stokes equations in steady state without fixing the pressure somewhere. The Inflow boundary condition fixes the mass fraction or mole fraction of specified species and it is used in this model as a strategy to fix the mass fraction of O2 at the left boundary even if no flux exists in the system. An important aspect to remember is that the Inflow feature does not apply a constraint to the mass fraction of the species being computed From mass constraint and if the other species mass fractions attain important values the mass fraction of the mass constraint species can differ from the value specified. This can be avoided by setting to a small value the mass fraction of the species that attain large values in the inflow region.
Results and Discussion
Figure 1and Figure 2 show the spatial distribution of period averaged number densities for all charged species and for mole fraction of O2 of 0.9 and 0.1. In both cases the distribution of charged species is such that in the core of the discharge the dominant charged species are positive and negative ions. Electrons have a number density of two orders of magnitude lower which means that the electronegative is in the 100s. In the discharge edges the negative ion number density drops fast and the plasma becomes electropositive. For xO2 = 0.9 the dominant ion in the edge is O2+ and for xO2 = 0.1 the dominant ion in the edge is Ar+.
The fast drop in the negative ions density can cause numerical issues as explain before. In this model isotropic diffusion was used which smooths the negative ion profile and increase its density in the edges. It is important to not use to much isotropic diffusion so that the negative ion density in the edges becomes important.
Figure 1: Spatial distribution of period averaged number densities of charged species for an O2 mole fraction of 0.9.
Figure 2: Spatial distribution of period averaged number densities of charged species for an O2 mole fraction of 0.1.
References
1. M.A. Lieberman and A.J. Lichtenberg, Principles of Plasma Discharges and Materials Processing, John Wiley & Sons, 2005.
2. www.lxcat.net
3. J.T. Gudmundsson and E.G. Thorsteinsson, “Oxygen discharges diluted with argon: dissociation process,” Plasma Sources Sci. Technol., vol. 16, pp. 399–412, 2007.
4. Phelps database, www.lxcat.net, retrieved 2017.
5. Phelps database, www.lxcat.net, retrieved 2022.
6. Morgan database, www.lxcat.net, retrieved 2022.
Application Library path: Plasma_Module/Capacitively_Coupled_Plasmas/ccp_argon_oxygen
Modeling Instructions
From the File menu, choose New.
New
In the New window, click  Model Wizard.
Model Wizard
1
In the Model Wizard window, click  1D.
2
In the Select Physics tree, select Plasma > Plasma, Time Periodic (ptp).
3
Click Add.
4
Click  Study.
5
In the Select Study tree, select Preset Studies for Selected Physics Interfaces > Time Periodic.
6
Geometry 1
Create a 1D domain of length 4.5 cm that corresponds to the distance between plates in the reactor.
1
In the Model Builder window, under Component 1 (comp1) click Geometry 1.
2
In the Settings window for Geometry, locate the Units section.
3
From the Length unit list, choose cm.
Interval 1 (i1)
1
Right-click Component 1 (comp1) > Geometry 1 and choose Interval.
2
In the Settings window for Interval, locate the Interval section.
3
Add parameters that represent the mole fractions of O2 and Ar.
Global Definitions
Parameters 1
1
In the Model Builder window, under Global Definitions click Parameters 1.
2
In the Settings window for Parameters, locate the Parameters section.
3
The Plasma Chemistry Import feature
The next steps have instructions to use the Plasma Chemistry Import feature to import a file that automatically creates the argon-oxygen plasma chemistry.
The following is set or created automatically:
a
Species properties using Preset species data
b
c
The documentation accompanying the Plasma Chemistry Import feature contains more information about the file structure and what can be set automatically.
Plasma, Time Periodic (ptp)
Plasma Chemistry Import 1
1
In the Physics toolbar, click  Global and choose Plasma Chemistry Import.
2
In the Settings window for Plasma Chemistry Import, locate the Plasma Chemistry Import section.
3
Click  Browse.
4
5
Click  Import.
Materials
1
Click the  Show More Options button in the Model Builder toolbar.
2
In the Show More Options dialog, select Physics > Stabilization in the tree.
3
4
This model needs stabilization because the density of the negative ions can attain very small values at the reactor edges. The source and reaction source stabilizations add artificial creation to prevent the densities to reach very small values.
Plasma, Time Periodic (ptp)
1
In the Model Builder window, under Component 1 (comp1) click Plasma, Time Periodic (ptp).
2
In the Settings window for Plasma, Time Periodic, locate the Cross-Section Area section.
3
In the A text field, type pi*(14.36[cm])^2.
4
Locate the Extra Dimension Settings section. From the Heavy species selection list, choose Base geometry.
5
Click to expand the Stabilization section. Select the Source stabilization checkbox.
6
Click to expand the Inconsistent Stabilization section. Select the Isotropic diffusion for ions checkbox.
7
Locate the Stabilization section. Select the Reaction source stabilization checkbox.
8
Locate the Transport Settings section. Find the Include subsection. Select the Mixture diffusion correction checkbox.
9
Locate the Electron Energy Distribution Function Settings section. From the Electron energy distribution function list, choose Maxwellian.
In the following, the initial mole fraction for O2 and the initial number density for ions are specified. The mass fraction of Ar is found from a mass constraint and the initial density of Ar+ is found by requiring electroneutrality.
Species: O2
1
In the Model Builder window, expand the Component 1 (comp1) > Plasma, Time Periodic (ptp) > Group - Species node, then click Species: O2.
2
In the Settings window for Species, locate the General Parameters section.
3
In the x0 text field, type xO2.
Species: O-
1
In the Model Builder window, click Species: O-.
2
In the Settings window for Species, locate the General Parameters section.
3
In the n0 text field, type 1E10[1/m^3].
Species: O2+
1
In the Model Builder window, click Species: O2+.
2
In the Settings window for Species, locate the General Parameters section.
3
In the n0 text field, type 1E10[1/m^3].
Species: O+
1
In the Model Builder window, click Species: O+.
2
In the Settings window for Species, locate the General Parameters section.
3
In the n0 text field, type 1E10[1/m^3].
Species: Ar
1
In the Model Builder window, click Species: Ar.
2
In the Settings window for Species, locate the Species Formula section.
3
Select the From mass constraint checkbox.
Species: Ar+
1
In the Model Builder window, click Species: Ar+.
2
In the Settings window for Species, locate the Species Formula section.
3
Select the Initial value from electroneutrality constraint checkbox.
Group - Species
In the Model Builder window, collapse the Component 1 (comp1) > Plasma, Time Periodic (ptp) > Group - Species node.
The surface reactions used in the model were created automatically but it is still necessary to specify at which boundary they are going to exist.
Surface Reactions - Ions
1
In the Model Builder window, click Surface Reactions - Ions.
2
In the Settings window for Surface Reaction Group, locate the Boundary Selection section.
3
From the Selection list, choose All boundaries.
Surface Reactions - Neutrals
1
In the Model Builder window, click Surface Reactions - Neutrals.
2
In the Settings window for Surface Reaction Group, locate the Boundary Selection section.
3
From the Selection list, choose All boundaries.
Set the temperature and pressure of the background neutral gas.
Plasma Model 1
1
In the Model Builder window, click Plasma Model 1.
2
In the Settings window for Plasma Model, locate the Model Inputs section.
3
In the T text field, type 300[K].
4
In the pA text field, type 0.05[torr].
Initial Values 1
1
In the Model Builder window, click Initial Values 1.
2
In the Settings window for Initial Values, locate the Initial Values section.
3
In the ne,0 text field, type 1E15[1/m^3].
4
From the Initial electric potential list, choose User defined.
Add a Metal Contact node to provide electric excitation to the system.
Metal Contact 1
1
In the Physics toolbar, click  Boundaries and choose Metal Contact.
The Wall node sets boundary conditions for the electron transport equations.
2
3
In the Settings window for Metal Contact, locate the Terminal section.
4
From the Source list, choose RF.
5
Locate the RF Source section. In the Prf text field, type 10[W].
Wall 1
1
In the Physics toolbar, click  Boundaries and choose Wall.
2
In the Settings window for Wall, locate the Boundary Selection section.
3
From the Selection list, choose All boundaries.
Ground 1
1
In the Physics toolbar, click  Boundaries and choose Ground.
2
The Inflow node is used here to fix the mass fraction of O2 at the boundary even if there is no flow going into the reactor.
In the Plasma, Time Periodic interface with more than one species types are present, it is difficult to preserve mass among each species type. By fixing the mass fraction of one species at a point that problem does not occur.
Inflow 1
1
In the Physics toolbar, click  Boundaries and choose Inflow.
2
3
In the Settings window for Inflow, locate the Inflow section.
4
5
6
7
Outflow 1
1
In the Physics toolbar, click  Boundaries and choose Outflow.
2
In electronegative plasmas the negative ions density tends to have very steep gradients at the transition of the electronegative core and electropositive edges. On this transition, a fine mesh is required to prevent oscillations in the negative ion density.
Mesh 1
Edge 1
In the Mesh toolbar, click  Edge.
Distribution 1
1
Right-click Edge 1 and choose Distribution.
2
In the Settings window for Distribution, locate the Distribution section.
3
From the Distribution type list, choose Predefined.
4
In the Number of elements text field, type 150.
5
In the Element ratio text field, type 5.
6
Select the Symmetric distribution checkbox.
Solve for three molar fractions of O2 using the Auxiliary sweep.
Study 1
Step 1: Time Periodic
1
In the Model Builder window, under Study 1 click Step 1: Time Periodic.
2
In the Settings window for Time Periodic, click to expand the Study Extensions section.
3
Select the Auxiliary sweep checkbox.
4
5
6
In the Study toolbar, click  Compute.
Results
Neutral Species Number Density, Period Averaged (ptp)
1
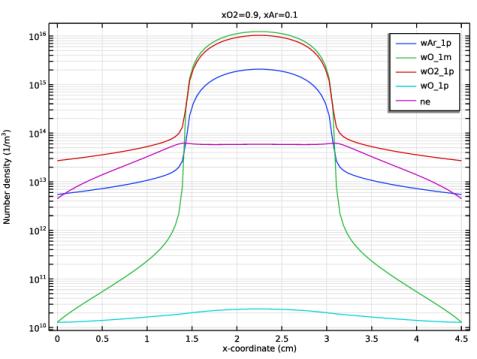
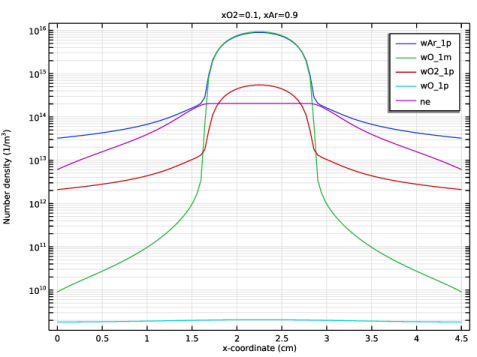
In the Model Builder window, under Results click Neutral Species Number Density, Period Averaged (ptp).
2
In the Settings window for 1D Plot Group, locate the Data section.
3
From the Parameter selection (xO2) list, choose From list.
4
In the Parameter values (xO2) list box, select 0.9.
5
In the Neutral Species Number Density, Period Averaged (ptp) toolbar, click  Plot.
Create plots of charged species for molar fractions of O2 equal to 0.1 and 0.9.
Charged Species Number Density, Period Averaged, xO2=0.9
1
In the Model Builder window, click Charged Species Number Density, Period Averaged (ptp).
2
In the Settings window for 1D Plot Group, click to expand the Title section.
3
In the Title text area, type xO2=0.9, xAr=0.1.
4
Locate the Data section. From the Parameter selection (xO2) list, choose From list.
5
In the Parameter values (xO2) list box, select 0.9.
6
In the Charged Species Number Density, Period Averaged (ptp) toolbar, click  Plot.
7
In the Label text field, type Charged Species Number Density, Period Averaged, xO2=0.9.
Charged Species Number Density, Period Averaged, xO2=0.1
1
Right-click Charged Species Number Density, Period Averaged, xO2=0.9 and choose Duplicate.
2
In the Settings window for 1D Plot Group, locate the Title section.
3
In the Title text area, type xO2=0.1, xAr=0.9.
4
In the Label text field, type Charged Species Number Density, Period Averaged, xO2=0.1.
5
Locate the Data section. In the Parameter values (xO2) list box, select 0.1.
6
In the Charged Species Number Density, Period Averaged, xO2=0.1 toolbar, click  Plot.
7
Right-click Charged Species Number Density, Period Averaged, xO2=0.1 and choose Move Up.