|
|
|


|
1
|
|
2
|
In the Select Physics tree, select Fluid Flow > Nonisothermal Flow > Nonisothermal Pipe Flow (nipfl).
|
|
3
|
Click Add.
|
|
4
|
In the Select Physics tree, select Heat Transfer > Porous Media > Heat Transfer in Porous Media (ht).
|
|
5
|
Click Add.
|
|
6
|
Click
|
|
7
|
|
8
|
Click
|
|
1
|
|
2
|
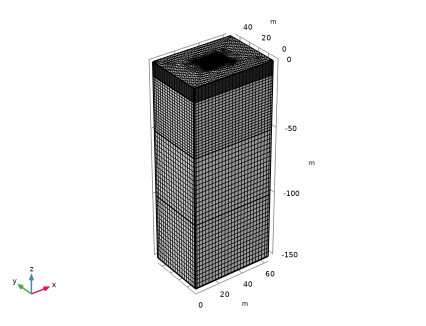
Browse to the model’s Application Libraries folder and double-click the file borehole_heat_exchanger_pipe_flow_geom_sequence.mph.
|
|
3
|
|
4
|
|
5
|
|
6
|
|
7
|
Clear the Automatic detection of small details checkbox.
|
|
1
|
|
2
|
|
1
|
Go to the Add Material window.
|
|
2
|
|
3
|
Click the Add to Component button in the window toolbar.
|
|
4
|
|
1
|
|
2
|
|
3
|
|
1
|
|
2
|
In the Settings window for Porous Material, type Porous Material: Holocene Sediments in the Label text field.
|
|
3
|
|
4
|
|
1
|
|
2
|
|
3
|
|
1
|
|
2
|
|
3
|
|
4
|
Locate the Material Contents section. In the table, enter the following settings:
|
|
1
|
In the Model Builder window, under Component 1 (comp1) right-click Materials and choose More Materials > Porous Material.
|
|
2
|
In the Settings window for Porous Material, type Porous Material: Pleistocene Sands in the Label text field.
|
|
3
|
|
4
|
|
1
|
|
2
|
|
3
|
|
1
|
|
2
|
|
3
|
|
4
|
Locate the Material Contents section. In the table, enter the following settings:
|
|
1
|
In the Model Builder window, under Component 1 (comp1) right-click Materials and choose More Materials > Porous Material.
|
|
2
|
|
3
|
|
4
|
|
5
|
|
1
|
|
2
|
|
3
|
|
1
|
|
2
|
|
3
|
|
4
|
Locate the Material Contents section. In the table, enter the following settings:
|
|
1
|
In the Model Builder window, under Component 1 (comp1) right-click Materials and choose More Materials > Porous Material.
|
|
2
|
In the Settings window for Porous Material, type Porous Material: Tertiary Sands in the Label text field.
|
|
3
|
|
4
|
|
1
|
|
2
|
|
3
|
|
1
|
|
2
|
|
3
|
|
4
|
Locate the Material Contents section. In the table, enter the following settings:
|
|
1
|
|
2
|
|
3
|
|
1
|
In the Model Builder window, under Component 1 (comp1) > Nonisothermal Pipe Flow (nipfl) click Pipe Properties 1.
|
|
2
|
|
3
|
From the list, choose Circular.
|
|
4
|
|
1
|
|
2
|
|
3
|
|
1
|
|
2
|
|
3
|
|
4
|
|
1
|
|
2
|
|
3
|
|
1
|
|
2
|
|
3
|
|
4
|
|
5
|
|
1
|
|
2
|
|
3
|
|
1
|
|
2
|
|
3
|
|
1
|
|
2
|
|
3
|
|
4
|
In the text field, type 0.38[W/m/K].
|
|
5
|
|
6
|
In the text field, type pth. Now you have added the thermal conductivity of the pipe material and the pipe wall thickness. In a second layer consider the grouting material which fills the space between pipes and borehole walls.
|
|
1
|
|
2
|
|
3
|
|
4
|
In the text field, type 2.4[W/m/K].
|
|
5
|
|
6
|
In the text field, type r_bore-r_pipe.
|
|
1
|
|
2
|
|
3
|
|
4
|
|
5
|
|
1
|
|
2
|
|
3
|
|
4
|
|
5
|
|
6
|
Click OK.
|
|
1
|
In the Model Builder window, under Component 1 (comp1) > Heat Transfer in Porous Media (ht) > Porous Medium 1 click Porous Matrix 1.
|
|
2
|
|
3
|
|
1
|
In the Model Builder window, under Component 1 (comp1) > Heat Transfer in Porous Media (ht) right-click Porous Medium 1 and choose Duplicate.
|
|
2
|
|
3
|
Click
|
|
1
|
|
2
|
|
3
|
Specify the u vector as
|
|
1
|
In the Model Builder window, under Component 1 (comp1) > Heat Transfer in Porous Media (ht) click Initial Values 1.
|
|
2
|
|
3
|
|
1
|
|
3
|
|
4
|
|
1
|
|
2
|
|
3
|
|
4
|
|
1
|
|
3
|
|
4
|
|
1
|
|
2
|
|
3
|
|
1
|
|
2
|
|
3
|
|
4
|
|
5
|
Click the Custom button.
|
|
6
|
Locate the Element Size Parameters section.
|
|
7
|
|
8
|
|
9
|
|
1
|
|
2
|
|
3
|
|
1
|
|
2
|
|
3
|
|
4
|
|
5
|
Click the Custom button.
|
|
6
|
Locate the Element Size Parameters section.
|
|
7
|
|
1
|
|
2
|
|
3
|
Click
|
|
5
|
|
1
|
|
2
|
|
3
|
Click
|
|
5
|
|
1
|
|
2
|
|
3
|
Click
|
|
5
|
|
1
|
|
2
|
|
3
|
Clear the Generate default plots checkbox.
|
|
1
|
|
2
|
|
3
|
|
4
|
|
1
|
|
2
|
|
3
|
|
4
|
From the Steps taken by solver list, choose Strict to ensure that the changes of the ambient temperature are represented properly.
|
|
1
|
|
2
|
Go to the Result Templates window.
|
|
3
|
In the tree, select Study 1/Solution 1 (sol1) > Heat Transfer in Porous Media > Temperature, Multislice (ht) and Study 1/Solution 1 (sol1) > Heat Transfer in Porous Media > Isothermal Contours (ht).
|
|
4
|
Click the Add Result Template button in the window toolbar.
|
|
5
|
|
1
|
|
2
|
|
3
|
|
4
|
|
5
|
|
6
|
|
7
|
|
8
|
|
9
|
|
10
|
|
1
|
|
2
|
|
3
|
Select the Show maximum and minimum values checkbox.
|
|
1
|
|
2
|
In the Settings window for Arrow Volume, click Replace Expression in the upper-right corner of the Expression section. From the menu, choose Component 1 (comp1) > Heat Transfer in Porous Media > Velocity and pressure > Porous medium, fluid > ht.porous.fluid.ux,...,ht.porous.fluid.uz - Velocity field.
|
|
3
|
|
1
|
|
2
|
|
3
|
|
4
|
|
5
|
|
6
|
|
7
|
|
8
|
|
1
|
|
2
|
|
3
|
|
4
|
|
5
|
|
6
|
|
1
|
|
2
|
|
3
|
|
4
|
|
5
|
|
6
|
|
1
|
|
2
|
|
3
|
|
4
|
|
5
|
|
6
|
|
7
|
|
8
|
|
9
|
|
1
|
|
2
|
|
3
|
|
4
|
Locate the Legends section. In the table, enter the following settings:
|
|
1
|
|
2
|
|
3
|
|
4
|
Locate the Legends section. In the table, enter the following settings:
|
|
5
|
|
6
|
|
1
|
|
2
|
|
3
|
Select the Manual axis limits checkbox.
|
|
4
|
|
5
|
|
6
|
|
7
|
|
8
|
|
1
|
|
2
|
|
3
|
|
4
|
Click Replace Expression in the upper-right corner of the Expressions section. From the menu, choose Component 1 (comp1) > Heat Transfer in Porous Media > Heat sources > ht.Qlrtot - Total line heat source with radius - W/m.
|
|
5
|
Click
|
|
1
|
Go to the Table 1 window.
|
|
2
|
Click the Table Graph button in the window toolbar.
|
|
1
|