
|
|
|
|
•
|

|
1
|
|
2
|
In the Select Physics tree, select Heat Transfer > Metal Processing > Metal Phase Transformation (metp).
|
|
3
|
Click Add.
|
|
4
|
Click
|
|
5
|
|
6
|
Click
|
|
1
|
|
2
|
|
1
|
In the Model Builder window, under Component 1 (comp1) > Metal Phase Transformation (metp) click Metallurgical Phase 2.
|
|
2
|
|
3
|
Select the Compute transformation times checkbox.
|
|
4
|
Click
|
|
5
|
In the Target phase fractions table, enter the following settings:
|
|
1
|
|
2
|
|
3
|
|
4
|
|
5
|
|
6
|
|
1
|
|
2
|
|
3
|
|
4
|
Click
|
|
5
|
Locate the Data Column Settings section. In the table, enter the following settings:
|
|
7
|
|
8
|
|
11
|
|
12
|
|
13
|
|
14
|
|
1
|
|
2
|
|
3
|
|
4
|
|
5
|
Click
|
|
6
|
Locate the Data Column Settings section. In the table, click to select the cell at row number 3 and column number 2.
|
|
7
|
|
8
|
|
1
|
|
2
|
|
3
|
|
4
|
|
5
|
Click
|
|
6
|
Locate the Data Column Settings section. In the table, click to select the cell at row number 3 and column number 2.
|
|
7
|
|
8
|
|
1
|
|
2
|
|
3
|
Click
|
|
4
|
|
5
|
|
6
|
|
7
|
|
8
|
Click Replace.
|
|
9
|
|
10
|
Select the Auxiliary sweep checkbox.
|
|
11
|
Click
|
|
1
|
|
2
|
|
3
|
Click
|
|
1
|
|
2
|
|
3
|
|
4
|
Locate the Objective Function section. In the table, select the Active checkboxes for Least-Squares Objective 1, Least-Squares Objective 2, and Least-Squares Objective 3.
|
|
5
|
|
7
|
|
8
|
|
9
|
|
10
|
|
1
|
In the Model Builder window, under Results, Ctrl-click to select Phase Composition (metp), Transformation Diagram (metp), Parameter estimation, Parameter estimation 1, and Parameter estimation 2.
|
|
2
|
Right-click and choose Delete.
|
|
1
|
|
2
|
|
3
|
|
4
|
|
1
|
|
2
|
|
4
|
|
1
|
|
2
|
|
3
|
|
4
|
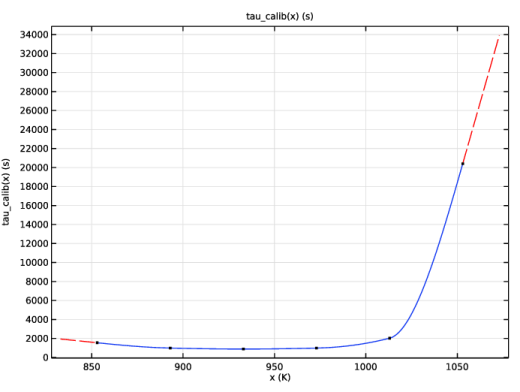
Locate the Output section. In the Filename text field, type calibration_against_ttt_data_tau_calib.txt.
|
|
1
|
|
2
|
|
3
|
|
4
|
Click
|
|
5
|
Browse to the model’s Application Libraries folder and double-click the file calibration_against_ttt_data_tau_calib.txt.
|
|
6
|
Locate the Data Column Settings section. In the table, enter the following settings:
|
|
8
|
|
10
|
|
11
|
|
12
|
Locate the Interpolation and Extrapolation section. From the Interpolation list, choose Piecewise cubic.
|
|
13
|
|
14
|
Click
|
|
15
|
Click
|
|
1
|
|
2
|
Go to the Add Physics window.
|
|
3
|
|
4
|
Click the Add to Component 1 button in the window toolbar.
|
|
5
|
|
1
|
|
2
|
Select the Compute transformation times checkbox.
|
|
3
|
Click
|
|
4
|
In the Target phase fractions table, enter the following settings:
|
|
5
|
|
6
|
|
7
|
|
1
|
|
2
|
|
3
|
|
4
|
|
5
|
|
6
|
|
1
|
|
2
|
Go to the Add Study window.
|
|
3
|
|
4
|
Click the Add Study button in the window toolbar.
|
|
5
|
|
1
|
|
2
|
Click
|
|
3
|
|
4
|
|
5
|
|
6
|
|
7
|
Click Replace.
|
|
8
|
|
9
|
In the Solve for column of the table, under Component 1 (comp1), clear the checkbox for Metal Phase Transformation (metp).
|
|
10
|
|
11
|
Click
|
|
13
|
|
1
|
|
2
|
|
3
|
|
4
|
|
5
|
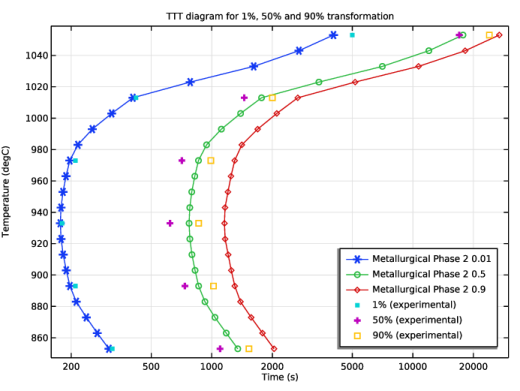
Browse to the model’s Application Libraries folder and double-click the file calibration_against_ttt_data_ttt001.txt.
|
|
1
|
|
2
|
|
3
|
|
4
|
Browse to the model’s Application Libraries folder and double-click the file calibration_against_ttt_data_ttt050.txt.
|
|
1
|
|
2
|
|
3
|
|
4
|
Browse to the model’s Application Libraries folder and double-click the file calibration_against_ttt_data_ttt090.txt.
|
|
1
|
|
2
|
|
3
|
|
4
|
|
5
|
|
6
|
|
7
|
|
1
|
|
2
|
|
3
|
|
4
|
|
5
|
|
6
|
|
7
|
Locate the Coloring and Style section. Find the Line style subsection. From the Line list, choose None.
|
|
8
|
|
9
|
|
10
|