|
|
|
|
1
|
|
2
|
In the Select Physics tree, select Structural Mechanics > Electromagnetics–Structure Interaction > Piezoelectricity > Piezoelectricity, Solid.
|
|
3
|
Click Add.
|
|
4
|
Click
|
|
5
|
|
6
|
Click
|
|
1
|
|
2
|
|
1
|
|
2
|
|
3
|
Clear the Avoid inverted elements by curving interior domain elements checkbox.
|
|
1
|
|
2
|
|
3
|
|
4
|
|
5
|
Browse to the model’s Application Libraries folder and double-click the file piezoelectric_rate_gyroscope_geom_sequence.mph.
|
|
6
|
|
7
|
|
1
|
|
2
|
|
3
|
Select the All domains checkbox.
|
|
4
|
|
5
|
|
1
|
|
2
|
Go to the Add Material window.
|
|
3
|
|
4
|
Click the Add to Component button in the window toolbar.
|
|
5
|
|
1
|
|
2
|
|
3
|
|
4
|
|
1
|
|
1
|
|
2
|
|
3
|
|
4
|
|
5
|
|
1
|
|
2
|
|
4
|
|
1
|
|
2
|
|
4
|
|
5
|
|
1
|
|
2
|
|
1
|
|
2
|
|
1
|
|
2
|
|
3
|
|
4
|
|
1
|
|
2
|
|
3
|
|
4
|
|
1
|
|
2
|
|
3
|
|
1
|
|
3
|
|
4
|
Click to select the
|
|
6
|
|
1
|
|
2
|
|
1
|
|
2
|
|
3
|
|
4
|
|
5
|
|
6
|
|
1
|
|
2
|
|
3
|
|
1
|
|
2
|
|
3
|
|
4
|
|
1
|
|
2
|
|
3
|
|
4
|
|
5
|
|
6
|
Locate the Scale section.
|
|
7
|
|
1
|
|
2
|
|
3
|
Select the Show legends checkbox.
|
|
4
|
|
5
|
|
6
|
|
7
|
|
8
|
|
9
|
|
10
|
|
1
|
|
2
|
Go to the Add Study window.
|
|
3
|
|
4
|
Click the Add Study button in the window toolbar.
|
|
5
|
|
1
|
|
2
|
|
1
|
In the Study toolbar, click
|
|
2
|
|
3
|
|
4
|
|
6
|
Click to expand the Store in Output section. In the table, enter the following settings:
|
|
8
|
|
9
|
|
10
|
Click OK.
|
|
11
|
|
14
|
|
15
|
|
16
|
Click OK.
|
|
17
|
|
1
|
|
2
|
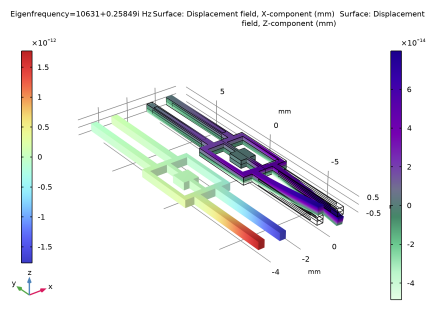
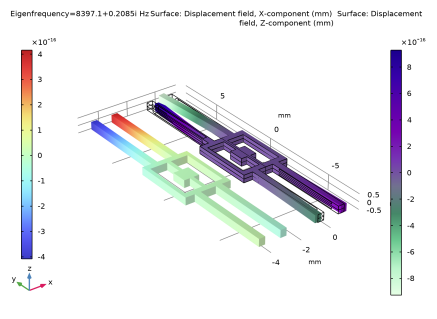
In the Settings window for 3D Plot Group, type Frequency Response: Displacement in the Label text field.
|
|
3
|
|
4
|
|
1
|
|
2
|
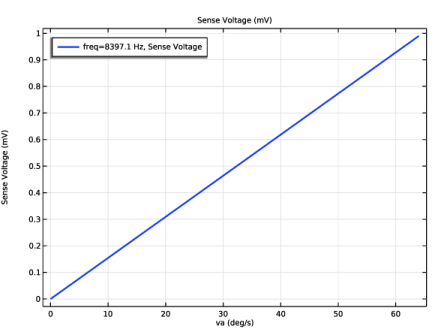
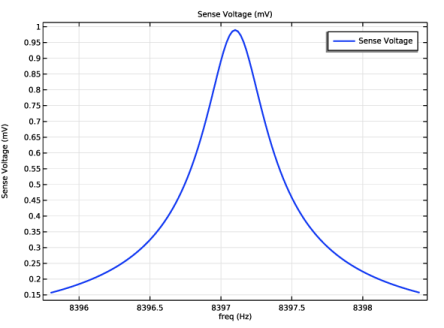
In the Settings window for 1D Plot Group, type Frequency Response: Sense Voltage in the Label text field.
|
|
3
|
|
1
|
|
2
|
|
3
|
Locate the y-Axis Data section. In the table, enter the following settings:
|
|
4
|
|
5
|
|
1
|
|
2
|
Go to the Add Study window.
|
|
3
|
|
4
|
Click the Add Study button in the window toolbar.
|
|
5
|
|
1
|
|
2
|
|
3
|
|
4
|
Click
|
|
6
|
|
7
|
|
8
|
Clear the Generate default plots checkbox.
|
|
9
|
|
10
|
|
1
|
|
2
|
|
3
|
|
4
|
|
5
|
|
1
|
In the Model Builder window, expand the Sensitivity: Sense Voltage vs. Angular Velocity node, then click Sense Voltage.
|
|
2
|
|
3
|
|
4
|