PDF

Mixed-Mode Delamination of a Composite Laminate
Introduction
Interfacial failure or delamination in a composite material can be simulated with a cohesive zone model (CZM). A key ingredient of a cohesive zone model is a traction-separation law that describes the softening in the cohesive zone near the delamination tip. This example shows the implementation of a CZM with a bilinear traction-separation law in a laminated composite using the Layered Shell interface. The capabilities of the CZM to predict mixed-mode softening and delamination propagation are demonstrated in this example.
This example is an extension of the Structural Mechanics Module Application Library model Mixed-Mode Debonding of a Laminated Composite in which the Layered Shell interface is used to model delamination. The results are compared with the model created using the Solid Mechanics interface.
Model Definition
Cohesive Zone Model (CZM)
The CZM used in this example is defined using the displacement based damage model available in the Delamination node. The model is used to predict crack propagation at the interface of a laminated composite beam under mixed-mode loading. The material properties needed for this constitutive model are summarized in Table 1.
pn
106 N/mm3
Gct
Gcs
The CZM is defined using a bilinear traction-separation law. Traction increases linearly with a stiffness pn until the opening crack reaches a damage initiation displacement u0. When the crack opens beyond u0, the material softens irreversibly and the stiffness decreases as a function of increasing damage d. The material fails once the stiffness has decreased to zero, that is when d = 1. This happens at the ultimate displacement uf.
The values of u0 and uf depend on whether the separation displacement is normal (mode I) or tangential (mode II and III) to an interface. For the mixed mode, a combination is used. For the displacement based damage model, two different criteria are available to define this combination. Here the Benzeggagh and Kenane criterion is used.
Mixed-mode bending of a laminated composite beam
A commonly used method to measure the delamination resistance of composite materials is the mixed-mode bending (MMB) test, see Ref. 1 and Ref. 2. This experimental procedure is here modeled to demonstrate the capabilities of the CZM.
The geometry of the test specimen is illustrated in Figure 1. It consists of a beam cracked along a ply interface halfway through its thickness. The initial crack length is cl. The beam is supported at the outermost bottom edges. A mixed-mode bending load is produced as the result of forces applied to the top edges at the cracked end and at the center of the beam.
Because of the symmetry, only half of the beam is modeled and a Symmetry boundary condition is applied. As the Layered Shell interface only requires a boundary selection, only the middle surface of the 3D geometry is modeled and the Midplane on boundary option is chosen in the Layered Material Link node.
Figure 1: The geometry of the test specimen.
The material properties are those of AS4/PEEK unidirectional laminates and are listed in Table 2. The transverse isotropic linear elastic properties assume that the longitudinal direction is aligned with the global X direction. The AS4/PEEK unidirectional laminate is a built-in material in the Composites material library.
EX
EY=EZ
νYZ
νXY=νXZ
GXY=GXZ
The beam is supported on the bottom at its outer edges. A lever that sits on top of the beam applies a load. The lever is also attached to the cracked end and swivels around a contact area at the center of the beam. The lever is pushed down at the opposite free end, thereby simultaneously applying mode I and mode II loads on the test specimen. Arbitrary ratios of mixed-mode loading can be adjusted by varying the length of the lever ll.
In this example, the lever is omitted. Instead, the forces that the lever transmits to the beam are applied directly. A pulling force Fe is acting on the cracked side of the beam. At the center, a force Fm pushes down. The desired mixed-mode ratio mm regulates the ratio of their magnitudes lr via
Further details on the background of the equation above can be found in Ref. 1 and Ref. 2.
Results and Discussion
For composite materials, von Mises stress is generally not an appropriate stress measure. In this model, however, it is applied because the stresses in directions other than the fiber direction are negligible, making von Mises stress a reasonable representation of the fiber stress in absolute terms. It is also used since the benchmark results from the Solid Mechanics interface are reported in terms of von Mises stress.
The model is analyzed for a mixed-mode ratio of 50%. The von Mises stress distribution of the last computed parameter step is shown in Figure 2 for the Layered Shell model. When compared with the Solid Mechanics model (see plot in model), the distribution of stresses from the Layered Shell model matches closely. At this step, the initial crack has propagated along the interface as shown in Figure 3. Here also the interface health predicted by the Layered Shell model show excellent agreement with the Solid Mechanics model.
Figure 2: The von Mises stress distribution at the last computation step.
Figure 3: Plot showing the health of the laminate interface. The debonded part is shown in red, the intact part in green.
One of the outputs of the MMB test is a load-displacement curve. Both the load and displacement are measured at the endpoint of the lever that is used to apply the load to the test specimen. Since the lever is not explicitly modeled, the load-displacement data has to be deduced from the simulation results. Details of the analysis are contained in Ref. 1 and Ref. 2, with the following result.
The force Flp at the load point of the lever can be determined from the load applied to the cracked edge in the model Fe and the lengths of the test beam lb and load lever ll:
.
The length of the load lever above depends on the desired mode mixture mm:
.
Note, that ll measures the length from the center of the test specimen to the free end of the load lever.
The displacement at the load point ulp is computed from the mode I opening at the cracked edge uIe and the z-displacement at the center of the beam wc according to
.
The resulting load-displacement curve is shown in Figure 4 for both the Layered Shell and Solid Mechanics models, the two curves closely match with each other. The load-displacement curve confirms what Figure 3 displayed. The maximal load that the beam with the initial crack can carry is exceeded and delamination occurs. After the peak load, the load decreases until the displacement reaches around 7 mm. This point approximately corresponds to when the crack reaches the center of the specimen. Thereafter, the load starts to increase again, but with a much lower stiffness than before delamination.
Figure 4: Load-displacement curve of the MMB test at 50% mixed-mode loading.
Notes About the COMSOL Implementation
Modeling a composite laminate as a layered shell requires a surface geometry, in general referred to as a base surface, and a Layered Material node which adds an extra dimension (1D) to the base surface geometry in the surface normal direction. You can use the Layered Material functionality to model several layers stacked on top of each other having different thicknesses, material properties, and fiber orientations. You can optionally specify the interface materials between the layers, and control the number of through-thickness mesh elements for each layer.
The third direction for the selected coordinate system in the Single Layer Material, Layered Material Link, or Layered Material Stack represents the normal direction of the Layered Shell or Shell physics. This is also the direction in which the layer stacking is interpreted from bottom to top, and therefore, it is crucial to know it during modeling. There are two ways to achieve this:
-
Using physics symbols: Go to the physics settings, find the Physics Symbols section, and select the Enable physics symbols checkbox. Then go to the material feature, for instance, Linear Elastic Material, to see the normal direction represented by green arrows in the geometry.
-
The built-in Composites material library contains data for fiber and matrix constituents as well as for unidirectional and bidirectional laminae.
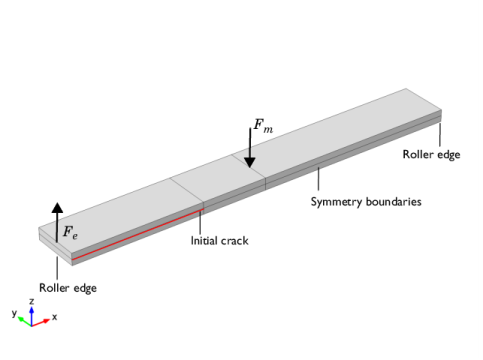
To implement a cohesive zone model in the Layered Shell interface, use the Delamination node, in which you can model adhesion, delamination and contact after delamination. There are two different ways to specify adhesion stiffness, with the default being taken from the interface material properties. Delamination laws based on either displacement or energy are used to model the separation of the interface. The contact after delamination is modeled by pressure penalty contact method.
The Delamination node can be used to model already delaminated region by setting initial state to delaminated. To model the portion of interface that is not delaminated, set the initial state to bonded. The Delamination node is only applicable to internal interface of composite laminates.
References
1. P.P. Camanho, C.G. Davila, and M.F. De Moura, “Numerical Simulation of Mixed-mode Progressive Delamination in Composite Materials,” J. Compos. Mater., vol. 37, no. 16, pp. 1415–1438, 2003.
2. J.R. Reeder and J.R. Crews Jr., “Mixed-Mode Bending Method for Delamination Testing,” AiAA J., vol. 28, no. 7, pp. 1270–1276, 2003.
Application Library path: Composite_Materials_Module/Delamination/mixed_mode_delamination
Modeling Instructions
Root
In this example you will start from an existing model that is an example in the Structural Mechanics Module.
Application Libraries
1
From the File menu, choose Application Libraries.
2
In the Application Libraries window, select Structural Mechanics Module > Contact and Friction > cohesive_zone_debonding in the tree.
3
Component [Solid Mechanics]
1
In the Model Builder window, click Component 1 (comp1).
2
In the Settings window for Component, type Component [Solid Mechanics] in the Label text field.
Study [Solid Mechanics]
1
In the Model Builder window, click Study 1.
2
In the Settings window for Study, type Study [Solid Mechanics] in the Label text field.
Results
Interface Health, Interface Health: Gauss Points, Stress (solid)
1
In the Model Builder window, under Results, Ctrl-click to select Stress (solid), Interface Health, and Interface Health: Gauss Points.
2
Solid Mechanics Plots
1
In the Settings window for Group, type Solid Mechanics Plots in the Label text field.
2
In the Model Builder window, collapse the Solid Mechanics Plots node.
Add a new component in order to set up a similar model with the Layered Shell interface.
Add Component
In the Model Builder window, right-click the root node and choose Add Component > 3D.
Component [Layered Shell]
In the Settings window for Component, type Component [Layered Shell] in the Label text field.
Geometry 2
Work Plane 1 (wp1)
1
In the Geometry toolbar, click  Work Plane.
2
In the Settings window for Work Plane, click  Go to Plane Geometry.
Work Plane 1 (wp1) > Plane Geometry
In the Model Builder window, click Plane Geometry.
Work Plane 1 (wp1) > Rectangle 1 (r1)
1
In the Work Plane toolbar, click  Rectangle.
2
In the Settings window for Rectangle, locate the Size and Shape section.
3
In the Width text field, type lb.
4
In the Height text field, type wb/2.
Work Plane 1 (wp1) > Rectangle 2 (r2)
1
In the Work Plane toolbar, click  Rectangle.
2
In the Settings window for Rectangle, locate the Size and Shape section.
3
In the Width text field, type lb/2-cl.
4
In the Height text field, type wb/2.
5
Locate the Position section. In the xw text field, type cl.
Work Plane 1 (wp1) > Union 1 (uni1)
1
In the Work Plane toolbar, click  Booleans and Partitions and choose Union.
2
Click the  Select Box button in the Graphics toolbar.
3
Click in the Graphics window and then press Ctrl+A to select both objects.
Form Union (fin)
1
In the Home toolbar, click  Build All.
2
Click the  Go to Default View button in the Graphics toolbar.
3
Click the  Zoom Extents button in the Graphics toolbar.
Definitions (comp2)
Integration Edge
1
In the Definitions toolbar, click  Nonlocal Couplings and choose Integration.
2
In the Settings window for Integration, type Integration Edge in the Label text field.
3
Locate the Source Selection section. From the Geometric entity level list, choose Point.
4
5
Locate the Advanced section. From the Frame list, choose Material  (X, Y, Z).
Integration Center
1
Right-click Integration Edge and choose Duplicate.
2
In the Settings window for Integration, type Integration Center in the Label text field.
3
Locate the Source Selection section. Click  Clear Selection.
4
Load Point Variables
1
In the Model Builder window, right-click Definitions and choose Variables.
2
In the Settings window for Variables, type Load Point Variables in the Label text field.
3
Locate the Variables section. In the table, enter the following settings:
Global Definitions
Layered Material 1 (lmat1)
1
In the Model Builder window, under Global Definitions right-click Materials and choose Layered Material.
2
In the Settings window for Layered Material, locate the Layer Definition section.
3
4
Materials
Layered Material Link 1 (llmat1)
In the Model Builder window, under Component [Layered Shell] (comp2) right-click Materials and choose Layers > Layered Material Link.
The geometry is in an XY-plane in which the fibers are oriented with respect to the X direction. Hence set the first axis of the laminate coordinate system in the X direction. Also set the frame of the Boundary System to reference configuration.
Definitions (comp2)
Boundary System 2 (sys2)
1
In the Settings window for Boundary System, locate the Settings section.
2
Find the Coordinate names subsection. From the Axis list, choose x.
3
From the Frame list, choose Reference configuration.
Add Physics
1
In the Home toolbar, click  Add Physics to open the Add Physics window.
2
Go to the Add Physics window.
3
In the tree, select Structural Mechanics > Layered Shell (lshell).
4
Click the Add to Component [Layered Shell] button in the window toolbar.
5
In the Home toolbar, click  Add Physics to close the Add Physics window.
Layered Shell (lshell)
For the portion of interface that is initially delaminated, the initial state in Delamination node can be set to Delaminated.
Delamination 1
1
In the Physics toolbar, click  Boundaries and choose Delamination.
2
3
In the Settings window for Delamination, locate the Initial State section.
4
5
Locate the Contact section. In the pn text field, type pn.
For the portion of interface that is not yet delaminated, the initial state in Delamination node can be set to Bonded. To model contact between delaminated interfaces, the penalty factor taken from the adhesive stiffness.
Delamination 2
1
In the Physics toolbar, click  Boundaries and choose Delamination.
2
3
In the Settings window for Delamination, locate the Adhesion section.
4
From the Adhesive stiffness list, choose User defined.
5
Specify the kA vector as
6
Locate the Delamination section. In the σts text field, type sigmat.
7
In the σss text field, type sigmas.
8
In the Gct text field, type Gct.
9
In the Gcs text field, type Gcs.
10
From the Mixed mode criterion list, choose Benzeggagh–Kenane.
11
In the α text field, type alpha.
12
Locate the Contact section. From the Penalty factor list, choose From adhesive stiffness.
Symmetry 1
1
In the Physics toolbar, click  Edges and choose Symmetry.
2
Load on Cracked Edge (Fe)
1
In the Physics toolbar, click  Edges and choose Edge Load.
2
In the Settings window for Edge Load, type Load on Cracked Edge (Fe) in the Label text field.
3
Locate the Force section. From the Load type list, choose Total force.
4
5
Specify the Ftot vector as
Load on Middle Edge (Fm)
1
Right-click Load on Cracked Edge (Fe) and choose Duplicate.
2
In the Settings window for Edge Load, type Load on Middle Edge (Fm) in the Label text field.
3
Locate the Edge Selection section. Click  Clear Selection.
4
5
Locate the Force section. Specify the Ftot vector as
Prescribed Displacement, Interface 1
1
In the Physics toolbar, click  Edges and choose Prescribed Displacement, Interface.
2
3
In the Settings window for Prescribed Displacement, Interface, locate the Interface Selection section.
4
From the Apply to list, choose Bottom interface.
5
Locate the Prescribed Displacement section. From the Displacement in z direction list, choose Prescribed.
Prescribed Displacement, Interface 2
1
In the Physics toolbar, click  Points and choose Prescribed Displacement, Interface.
2
3
In the Settings window for Prescribed Displacement, Interface, locate the Interface Selection section.
4
From the Apply to list, choose Bottom interface.
5
Locate the Prescribed Displacement section. From the Displacement in x direction list, choose Prescribed.
6
Click the  Show More Options button in the Model Builder toolbar.
7
In the Show More Options dialog, in the tree, select the checkbox for the node Physics > Equation Contributions.
8
This is to make Global Equations accessible. Add a global equation to control the applied load with a monotonically increasing parameter.
Global Equations 1 (ODE1)
1
In the Physics toolbar, click  Global and choose Global Equations.
2
In the Settings window for Global Equations, locate the Global Equations section.
3
4
Locate the Units section. Click  Define Dependent Variable Unit.
5
Click  Select Dependent Variable Quantity.
6
In the Physical Quantity dialog, type force in the text field.
7
In the tree, select General > Force (N).
8
9
In the Settings window for Global Equations, locate the Units section.
10
Click  Select Source Term Quantity.
11
In the Physical Quantity dialog, type length in the text field.
12
In the tree, select General > Length (m).
13
Use the same meshing as for the solid model.
Mesh 2
Copy 1
1
In the Mesh toolbar, click  Copy and choose Copy.
2
In the Settings window for Copy, locate the Source Mesh section.
3
From the Mesh list, choose Mesh 1.
4
5
Locate the Destination Entities section. Click to select the  Activate Selection toggle button.
6
From the Selection list, choose All boundaries.
7
Click  Build All.
Disable the Layered Shell interface in the first study.
Study [Solid Mechanics]
Step 1: Stationary
1
In the Model Builder window, expand the Study [Solid Mechanics] node, then click Step 1: Stationary.
2
In the Settings window for Stationary, locate the Physics and Variables Selection section.
3
In the Solve for column of the table, under Component [Layered Shell] (comp2), clear the checkbox for Layered Shell (lshell).
Add a new study for the Layered Shell interface and disable the Solid Mechanics interface.
Add Study
1
In the Study toolbar, click  Add Study to open the Add Study window.
2
Go to the Add Study window.
3
Find the Studies subsection. In the Select Study tree, select General Studies > Stationary.
4
5
In the Study toolbar, click  Add Study to close the Add Study window.
Study [Layered Shell]
In the Settings window for Study, type Study [Layered Shell] in the Label text field.
1
In the Model Builder window, under Study [Layered Shell] click Step 1: Stationary.
2
In the Settings window for Stationary, locate the Study Settings section.
3
Select the Include geometric nonlinearity checkbox.
4
Locate the Physics and Variables Selection section. In the Solve for column of the table, under Component [Solid Mechanics] (comp1), clear the checkbox for Solid Mechanics (solid).
5
Locate the Study Extensions section. Select the Auxiliary sweep checkbox.
6
7
8
9
Locate the Study Settings section. From the Tolerance list, choose User controlled.
10
In the Relative tolerance text field, type 1e-4.
Solution 2 (sol2)
1
In the Study toolbar, click  Show Default Solver.
2
In the Model Builder window, expand the Solution 2 (sol2) node.
3
In the Model Builder window, expand the Study [Layered Shell] > Solver Configurations > Solution 2 (sol2) > Dependent Variables 1 node, then click Displacement Field (Material and Geometry Frames) (comp2.u2).
4
In the Settings window for Field, locate the Scaling section.
5
From the Method list, choose Manual.
6
In the Scale text field, type 1e-3.
7
In the Model Builder window, under Study [Layered Shell] > Solver Configurations > Solution 2 (sol2) > Dependent Variables 1 click Global Equations 1 (comp2.ODE1).
8
In the Settings window for State, locate the Scaling section.
9
From the Method list, choose Manual.
10
In the Scale text field, type 200.
Use a linear predictor.
11
In the Model Builder window, expand the Study [Layered Shell] > Solver Configurations > Solution 2 (sol2) > Stationary Solver 1 node, then click Parametric 1.
12
In the Settings window for Parametric, click to expand the Continuation section.
13
Select the Tuning of step size checkbox.
14
In the Minimum step size text field, type 1e-6.
15
From the Predictor list, choose Linear.
Switch to an undamped Newton method.
16
In the Model Builder window, under Study [Layered Shell] > Solver Configurations > Solution 2 (sol2) > Stationary Solver 1 click Fully Coupled 1.
17
In the Settings window for Fully Coupled, click to expand the Method and Termination section.
18
From the Nonlinear method list, choose Constant (Newton).
19
In the Study toolbar, click  Compute.
Results
Surface 1
Update the default plot expression to von Mises stress to allow comparison with results from the Solid Mechanics interface.
1
In the Model Builder window, expand the Stress (lshell) node, then click Surface 1.
2
In the Settings window for Surface, locate the Expression section.
3
In the Expression text field, type lshell.misesGp.
4
From the Unit list, choose MPa.
5
Clear the Description checkbox.
Stress (lshell)
1
In the Model Builder window, click Stress (lshell).
2
In the Stress (lshell) toolbar, click  Plot.
Interface Health (lshell)
1
In the Results toolbar, click  3D Plot Group.
2
In the Settings window for 3D Plot Group, type Interface Health (lshell) in the Label text field.
3
Locate the Data section. From the Dataset list, choose Study [Layered Shell]/Solution 2 (3) (sol2).
4
Locate the Plot Settings section. From the Frame list, choose Spatial  (x, y, z).
Layered Material Slice 1
1
In the Interface Health (lshell) toolbar, click  More Plots and choose Layered Material Slice.
2
In the Settings window for Layered Material Slice, locate the Expression section.
3
In the Expression text field, type lshell.idmg.
4
Locate the Through-Thickness Location section. From the Location definition list, choose Interfaces.
5
Locate the Coloring and Style section. From the Color table list, choose Traffic.
Interface Health (lshell)
1
In the Model Builder window, click Interface Health (lshell).
2
In the Interface Health (lshell) toolbar, click  Plot.
Interface Health (lshell), Stress (lshell)
1
In the Model Builder window, under Results, Ctrl-click to select Stress (lshell) and Interface Health (lshell).
2
Layered Shell Plots
1
In the Settings window for Group, type Layered Shell Plots in the Label text field.
2
Right-click Layered Shell Plots and choose Move Up.
3
In the Model Builder window, collapse the Layered Shell Plots node.
Load Displacement Curve
1
In the Model Builder window, click Load Displacement Curve.
2
In the Settings window for 1D Plot Group, locate the Plot Settings section.
3
Select the x-axis label checkbox. In the associated text field, type Point Displacement (m).
4
Select the y-axis label checkbox. In the associated text field, type Point Load (N).
Global 1
1
In the Model Builder window, expand the Load Displacement Curve node, then click Global 1.
2
In the Settings window for Global, click to expand the Title section.
3
From the Title type list, choose Manual.
4
In the Title text area, type Load Displacement Curve.
5
Locate the x-Axis Data section. From the Unit list, choose m.
6
Click to expand the Legends section. Select the Show legends checkbox.
7
From the Legends list, choose Manual.
8
Global 2
1
Right-click Results > Load Displacement Curve > Global 1 and choose Duplicate.
2
In the Settings window for Global, locate the Data section.
3
From the Dataset list, choose Study [Layered Shell]/Solution 2 (3) (sol2).
4
Locate the y-Axis Data section. In the table, enter the following settings:
5
Locate the x-Axis Data section. In the Expression text field, type comp2.u_lpL.
6
Locate the Title section. From the Title type list, choose None.
7
Click to expand the Coloring and Style section. Locate the Legends section. In the table, enter the following settings:
8
In the Load Displacement Curve toolbar, click  Plot.
Load (lshell)
1
In the Results toolbar, click  Evaluation Group.
2
In the Settings window for Evaluation Group, type Load (lshell) in the Label text field.
3
Locate the Data section. From the Dataset list, choose Study [Layered Shell]/Solution 2 (3) (sol2).
Global Evaluation 1
1
Right-click Load (lshell) and choose Global Evaluation.
2
In the Settings window for Global Evaluation, locate the Expressions section.
3
4
Locate the Data Series Operation section. From the Transformation list, choose Maximum.
5
In the Load (lshell) toolbar, click  Evaluate.
Animation: Stress [Layered Shell]
1
In the Results toolbar, click  Animation and choose Player.
2
In the Settings window for Animation, type Animation: Stress [Layered Shell] in the Label text field.
3
Locate the Scene section. From the Subject list, choose Stress (lshell).
4
Locate the Playing section. In the Display each frame for text field, type 0.3.
5
Click to expand the Advanced section. Click  Show Frame.
6
Click the  Play button in the Graphics toolbar.