PDF

Parameter Estimation for Nonideal Reactor Models
Introduction
Real reactors can be modeled as combinations of ideal reactors. In this example, the “Dead zone model” is utilized. Two ideal CSTRs with interchange are used to model a real reactor. One CSTR represents the highly agitated region and the other one the less agitated region. Two parameters relating the volume and exchange rate of the two regions are required for this. The parameters are found by optimizing the model results to experimental tracer data. Adding a Parameter Estimation node with a Least-Squares Objective subnode makes this an easy task.
A problem description similar to the model presented here is given in Ref. 1.
Note: This application requires the Chemical Reaction Engineering Module.
Model Definition
Two ideal CSTRs with interchange capture the essential behavior of a real reactor system.
Figure 1: A real reactor can be modeled by two ideal CSTRs with interchange.
The highly agitated volume is represented by V1 and the less agitated region by V2. The total real reactor volume is defined as
(1)
and the parameter α gives the fraction of the total volume that belongs to V1:
Fluid is exchanged between volumes at a rate of v1 (SI unit: m3/s), and the parameter β relates this rate to the inlet flow rate:
Assuming that the reactor volume is constant, then the space time, τ (SI unit: s), is
Mass Balances
To evaluate the parameters α and β, a tracer compound is added through the reactor inlet stream, after which a response curve is measured at the outlet. Mass balances over the two CSTRs provide a model to which the experimental data can be compared. The mass balances are:
where cT1 is the tracer concentration (SI unit: mol /m3) in the region given by V1, and cT2 is the tracer concentration in V2. cT0 is the tracer amount into the real reactor. The tracer compound is said to be diluted in water.
This coupled set of ODEs can easily be set up by combining two Reaction Engineering interfaces where the reactor type is set to CSTR constant mass/generic.
Experimental data
An experiment is performed where a 1000 mol/m3 tracer solution is added in the reactor feed inlet stream. The tracer concentration in the reactor outlet stream is then recorded as a function of time. The data is presented in Table 1 below.
Results and Discussion
Figure 2 shows the model results, both when using an initial guess, and when using parameter estimation. The figure also shows the experimental data. The results from the parameter estimation are seen to coincide well with the experimental data.
Figure 2: Model results and experimental data of the tracer concentration in the real reactor outlet.
The estimated values of α and β are 0.83 and 0.11, respectively.
Reference
1. H.S. Fogler, Elements in Chemical Reaction Engineering, 4th ed., Prentice Hall, pp. 985–987, 2005.
Application Library path: Chemical_Reaction_Engineering_Module/Tutorials/nonideal_cstr
Modeling Instructions
From the File menu, choose New.
New
In the New window, click  Model Wizard.
Model Wizard
1
In the Model Wizard window, click  0D.
2
In the Select Physics tree, select Chemical Species Transport > Reaction Engineering (re).
3
Click Add.
4
Click  Study.
5
In the Select Study tree, select General Studies > Time Dependent.
6
Global Definitions
Add a set of model parameters by importing their definitions from a data text file provided with the Application Library.
Parameters 1
1
In the Model Builder window, under Global Definitions click Parameters 1.
2
In the Settings window for Parameters, locate the Parameters section.
3
Click  Load from File.
4
Start defining the first CSTR representing the highly agitated zone.
Reaction Engineering - CSTR 1
1
In the Model Builder window, under Component 1 (comp1) click Reaction Engineering (re).
2
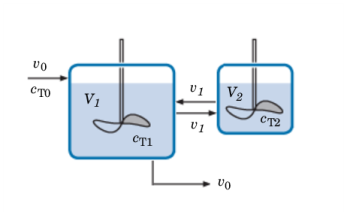
In the Settings window for Reaction Engineering, type Reaction Engineering - CSTR 1 in the Label text field.
3
In the Name text field, type re1.
4
Locate the Reactor section. From the Reactor type list, choose CSTR, constant mass/generic.
5
Locate the Mixture Properties section. From the Phase list, choose Liquid.
6
Locate the Reactor section. Find the Mass balance subsection. From the Volumetric rate list, choose Generic.
Two streams are assumed to exit the first CSTR: v0 and v0*beta.
7
In the v text field, type (1+beta)*v0.
Species 1
1
In the Reaction Engineering toolbar, click  Species.
2
In the Settings window for Species, locate the Name section.
3
4
In the Reaction Engineering toolbar, click  Species.
1
In the Settings window for Species, locate the Name section.
2
3
Locate the Type section. From the list, choose Solvent.
Species: T
1
In the Model Builder window, click Species: T.
2
In the Settings window for Species, locate the Chemical Formula section.
3
In the M text field, type Mn_T.
Species: H2O (Solvent)
1
In the Model Builder window, click Species: H2O (Solvent).
2
In the Settings window for Species, locate the Chemical Formula section.
3
In the ρ text field, type rho_w.
Initial Values 1
The first CSTR has an initial volume alpha times the total real reactor volume.
1
In the Model Builder window, click Initial Values 1.
2
In the Settings window for Initial Values, locate the General Parameters section.
3
In the Vr0 text field, type alpha*Vtot.
4
Locate the Volumetric Species Initial Values section. In the table, enter the following settings:
Add two feed inlet streams to the first CSTR. One representing the flow entering the real reactor, v0, and another one representing the stream from the second CSTR, v0*beta.
Feed Inlet 1
1
In the Reaction Engineering toolbar, click  Feed Inlet.
2
In the Settings window for Feed Inlet, locate the Feed Inlet Properties section.
3
In the vf text field, type v0.
4
Locate the Feed Inlet Concentration section. In the table, enter the following settings:
Feed Inlet 2
1
In the Reaction Engineering toolbar, click  Feed Inlet.
2
In the Settings window for Feed Inlet, locate the Feed Inlet Properties section.
3
In the vf text field, type v0*beta.
4
Locate the Feed Inlet Concentration section. In the table, enter the following settings:
Continue to define the second CSTR representing the dead zone. To do this copy the first interface.
5
In the Model Builder window, right-click Reaction Engineering - CSTR 1 (re1) and choose Copy.
Reaction Engineering - CSTR 2
1
In the Model Builder window, right-click Component 1 (comp1) and choose Paste Reaction Engineering.
2
In the Messages from Paste dialog, click OK.
3
In the Settings window for Reaction Engineering, type Reaction Engineering - CSTR 2 in the Label text field.
Only one stream exits the second CSTR: v0*beta.
4
Locate the Reactor section. Find the Mass balance subsection. In the v text field, type v0*beta.
Initial Values 1
The second CSTR has an initial volume (1-alpha) times the total real reactor volume.
1
In the Model Builder window, expand the Component 1 (comp1) > Reaction Engineering - CSTR 2 (re2) node, then click Initial Values 1.
2
In the Settings window for Initial Values, locate the General Parameters section.
3
In the Vr0 text field, type (1-alpha)*Vtot.
4
Locate the Volumetric Species Initial Values section. In the table, enter the following settings:
Feed Inlet 1
1
In the Model Builder window, click Feed Inlet 1.
2
In the Settings window for Feed Inlet, locate the Feed Inlet Properties section.
3
In the vf text field, type v0*beta.
4
Locate the Feed Inlet Concentration section. In the table, enter the following settings:
Remove the second feed inlet stream.
Feed Inlet 2
In the Model Builder window, right-click Feed Inlet 2 and choose Delete.
Solve the model using the initial values of the alpha and beta parameters.
Study 1: Initial Guess
1
In the Model Builder window, click Study 1.
2
In the Settings window for Study, type Study 1: Initial Guess in the Label text field.
Step 1: Time Dependent
1
In the Model Builder window, under Study 1: Initial Guess click Step 1: Time Dependent.
2
In the Settings window for Time Dependent, locate the Study Settings section.
3
In the Output times text field, type 24000.
4
In the Study toolbar, click  Compute.
Results
Concentration in Non-Ideal Reactor
Now look at, and modify, the two default plot groups that were created.
1
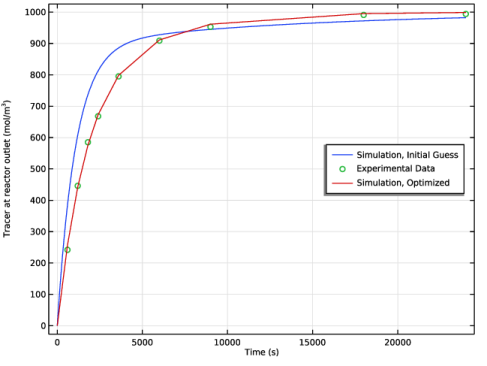
In the Settings window for 1D Plot Group, type Concentration in Non-Ideal Reactor in the Label text field.
2
Click to expand the Title section. From the Title type list, choose None.
3
Locate the Plot Settings section. Select the x-axis label checkbox.
4
Select the y-axis label checkbox. In the associated text field, type Tracer at reactor outlet (mol/m<sup>3</sup>).
5
Locate the Legend section. From the Position list, choose Middle right.
Simulation, Initial Guess
1
In the Model Builder window, expand the Concentration in Non-Ideal Reactor node, then click Global 1.
2
In the Settings window for Global, type Simulation, Initial Guess in the Label text field.
3
Click to expand the Legends section. Find the Include subsection. Select the Label checkbox.
4
Clear the Solution checkbox.
5
Clear the Expression checkbox.
6
In the Concentration in Non-Ideal Reactor toolbar, click  Plot.
To plot the experimental data, add a Table and then a Table Graph to the plot group.
Experimental Data
1
In the Results toolbar, click  Table.
2
In the Settings window for Table, type Experimental Data in the Label text field.
3
Locate the Data section. Click  Import.
4
Experimental Data
1
In the Model Builder window, right-click Concentration in Non-Ideal Reactor and choose Table Graph.
2
In the Settings window for Table Graph, type Experimental Data in the Label text field.
3
Click to expand the Legends section. Select the Show legends checkbox.
4
Find the Include subsection. Select the Label checkbox.
5
Clear the Headers checkbox.
6
In the Concentration in Non-Ideal Reactor toolbar, click  Plot.
7
Locate the Coloring and Style section. Find the Line style subsection. From the Line list, choose None.
8
Find the Line markers subsection. From the Marker list, choose Circle.
Now look at the other default plot group.
Concentration in CSTRs
1
In the Model Builder window, under Results click Concentration (re2).
2
In the Settings window for 1D Plot Group, type Concentration in CSTRs in the Label text field.
3
Locate the Title section. From the Title type list, choose None.
4
Locate the Legend section. From the Position list, choose Middle right.
Ideal CSTR 2
1
In the Model Builder window, expand the Concentration in CSTRs node, then click Global 1.
2
In the Settings window for Global, type Ideal CSTR 2 in the Label text field.
3
Locate the Legends section. Find the Include subsection. Select the Label checkbox.
Ideal CSTR 1
1
Right-click Ideal CSTR 2 and choose Duplicate.
2
In the Settings window for Global, type Ideal CSTR 1 in the Label text field.
3
Locate the y-Axis Data section. In the table, enter the following settings:
4
In the Concentration in CSTRs toolbar, click  Plot.
Now add a Parameter Estimation feature to be used in the optimization.
Component 1 (comp1)
Least-Squares Objective 1
1
In the Model Builder window, right-click Component 1 (comp1) and choose Parameter Estimation.
Use the experimental data in the Table already created.
2
In the Settings window for Least-Squares Objective, locate the Experimental Data section.
3
From the Data source list, choose Result table.
4
Locate the Data Column Settings section. In the Model expression text field, type re1.c_T.
5
In the Column name text field, type c_T.
6
In the Unit text field, type mol/m^3.
Add a new study node for the optimization calculations.
Add Study
1
In the Home toolbar, click  Add Study to open the Add Study window.
2
Go to the Add Study window.
3
Find the Studies subsection. In the Select Study tree, select General Studies > Time Dependent.
4
Click the Add Study button in the window toolbar.
5
In the Home toolbar, click  Add Study to close the Add Study window.
Study 2
Step 1: Time Dependent
1
In the Settings window for Time Dependent, locate the Study Settings section.
2
In the Output times text field, type 24000.
Add a Parameter Estimation study step to perform the parameter estimation calculations.
3
In the Model Builder window, click Study 2.
4
In the Settings window for Study, type Study 2: Parameter Estimation in the Label text field.
Parameter Estimation
1
In the Study toolbar, click  Optimization and choose Parameter Estimation.
2
In the Settings window for Parameter Estimation, locate the Estimated Parameters section.
3
Click  Add twice.
4
Use the default Levenberg–Marquardt optimization method. This method is very efficient for this type of optimization; when no mesh is affected and no additional constraints are present.
Before computing the optimization study, we want to choose to plot while solving. This makes it possible to visualize the optimization progress during computation.
5
In the Model Builder window, click Parameter Estimation.
6
In the Settings window for Study, locate the Study Settings section.
7
Clear the Generate default plots checkbox.
8
In the Study toolbar, click  Get Initial Value.
Results
Simulation, Optimized
1
In the Model Builder window, right-click Concentration in Non-Ideal Reactor and choose Global.
2
In the Settings window for Global, type Simulation, Optimized in the Label text field.
3
Locate the Data section. From the Dataset list, choose Study 2: Parameter Estimation/Solution 2 (sol2).
4
Locate the y-Axis Data section. In the table, enter the following settings:
5
Locate the Legends section. Find the Include subsection. Select the Label checkbox.
6
Clear the Solution checkbox.
7
Clear the Expression checkbox.
Now we can use the prepared plot to inspect the progress of the optimization.
Study 2: Parameter Estimation
Parameter Estimation
1
In the Model Builder window, under Study 2: Parameter Estimation click Parameter Estimation.
2
In the Settings window for Parameter Estimation, click to expand the Output section.
3
Select the Plot checkbox.
4
In the Study toolbar, click  Compute.
Results
Concentration in Non-Ideal Reactor
1
In the Model Builder window, under Results click Concentration in Non-Ideal Reactor.
2
In the Concentration in Non-Ideal Reactor toolbar, click  Plot.
The estimated parameters, together with the values for the objective function, can be found in the Objective Probe Table 2.
Calculate the difference (root mean square) between the two simulations and the experimental data.
Comparison 1
1
In the Model Builder window, right-click Simulation, Initial Guess and choose Comparison.
2
In the Settings window for Comparison, locate the Comparison section.
3
From the Metric list, choose RMS.
4
In the Concentration in Non-Ideal Reactor toolbar, click  Plot.
Comparison 1
1
In the Model Builder window, right-click Simulation, Optimized and choose Comparison.
2
In the Settings window for Comparison, locate the Comparison section.
3
From the Metric list, choose RMS.
4
In the Concentration in Non-Ideal Reactor toolbar, click  Plot.