
|
|
|
|
1
|
|
2
|
|
3
|
Click Add.
|
|
4
|
Click
|
|
5
|
|
6
|
Click
|
|
1
|
|
2
|
|
1
|
|
2
|
|
4
|
Click
|
|
1
|
|
1
|
|
3
|
|
4
|
|
1
|
|
2
|
Go to the Add Physics window.
|
|
3
|
|
4
|
Click the Add to Component 1 button in the window toolbar.
|
|
5
|
|
1
|
|
1
|
|
3
|
|
4
|
|
1
|
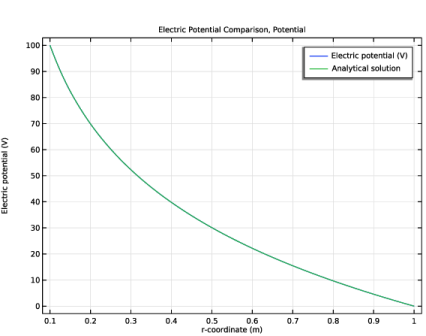
In the Settings window for 1D Plot Group, type Electric Potential Comparison, Potential in the Label text field.
|
|
2
|
|
3
|
|
1
|
|
3
|
|
4
|
|
5
|
|
6
|
|
7
|
|
8
|
|
1
|
|
2
|
|
3
|
Select the Show legends checkbox.
|
|
4
|
|
5
|
Clear the Solution checkbox.
|
|
6
|
Select the Description checkbox.
|
|
7
|
|
1
|
|
2
|
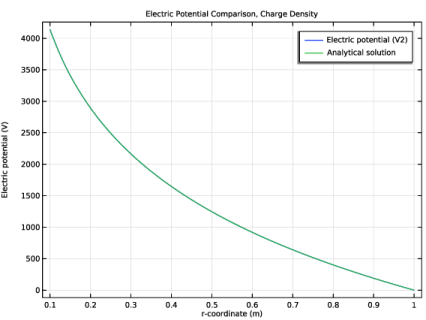
In the Settings window for 1D Plot Group, type Electric Potential Comparison, Charge Density in the Label text field.
|
|
3
|
|
4
|
|
1
|
|
3
|
|
4
|
|
5
|
|
6
|
|
7
|
|
8
|
|
1
|
|
2
|
|
3
|
Select the Show legends checkbox.
|
|
4
|
|
5
|
Clear the Solution checkbox.
|
|
6
|
Select the Description checkbox.
|
|
7
|
|
1
|
|
2
|
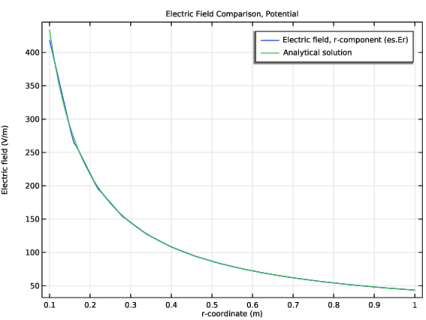
In the Settings window for 1D Plot Group, type Electric Field Comparison, Potential in the Label text field.
|
|
3
|
Locate the Plot Settings section.
|
|
4
|
|
5
|
|
1
|
|
3
|
|
4
|
|
5
|
|
6
|
|
7
|
|
8
|
|
9
|
Clear the Solution checkbox.
|
|
10
|
Select the Description checkbox.
|
|
1
|
In the Model Builder window, right-click Electric Field Comparison, Potential and choose Line Graph.
|
|
3
|
|
4
|
|
5
|
|
6
|
|
7
|
|
8
|
|
10
|
|
1
|
|
2
|
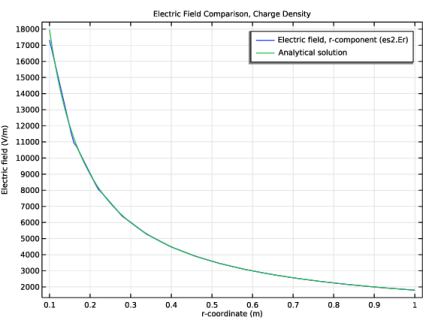
In the Settings window for 1D Plot Group, type Electric Field Comparison, Charge Density in the Label text field.
|
|
3
|
Locate the Plot Settings section.
|
|
4
|
|
5
|
|
1
|
|
3
|
|
4
|
|
5
|
|
6
|
|
7
|
|
8
|
|
9
|
Clear the Solution checkbox.
|
|
10
|
Select the Description checkbox.
|
|
1
|
In the Model Builder window, right-click Electric Field Comparison, Charge Density and choose Line Graph.
|
|
3
|
|
4
|
|
5
|
|
6
|
|
7
|
|
8
|
|
10
|