Results
Add a plot to show how the sensor response varies with temperature. The response is computed at an applied pressure set by the value of the parameter p0, defined as 20 kPa.
1D Plot Group 11
1
2
3
4
5
6
7
-
-
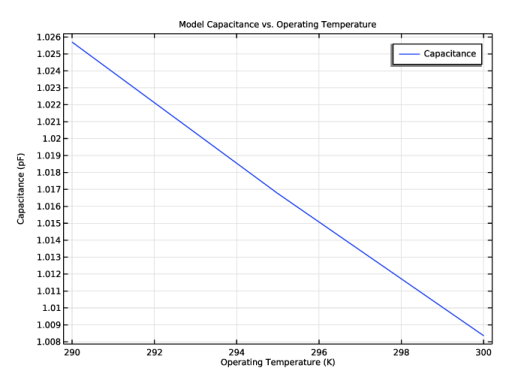
In the Title text area, enter Model Capacitance vs Operating Temperature.
8
-
9
In the Label text field enter Capacitance vs Operating Temperature.
10
At a pressure of 20 kPa the temperature sensitivity of the model is given by the gradient of this curve, approximately 3.5×10⁻³ pF/K (14×10-3 pF/K for the whole device). Given the pressure sensitivity of 25×10-6 pF/Pa at 20 kPa (for a single quadrant of the device) this corresponds to equivalent pressure of 140 Pa/K in the sensor output. Compared to the noise floor of the measuring circuit proposed in Practical MEMS (0.6 Pa) this number is very large. This model shows that a naive choice of packaging can have a highly detrimental effect on sensor performance.