Results
Create a mirrored dataset to visualize a cross section of the device.
Datasets
1
2
3
Displacement (solid) 1
1
2
3
Notice that the entire structure now has nonzero movements at room temperature, as a result of thermal stress.
Now look at the effect of the thermal stress on the response of the sensor.
Add an additional global node to the previously defined plot. This separate node can point to a different dataset, creating a plot of the displacement of the thermally stressed device alongside the unstressed plot.
Diaphragm Displacement vs Pressure
1
2
3
4
The maximum displacement of the membrane is now nonzero at zero applied pressure, as a result of the packaging stress. The gradient of the displacement-pressure line has also changed.
Model Capacitance vs Pressure
Now add the thermally stressed results to the Capacitance vs Pressure plot.
1
2
3
4
5
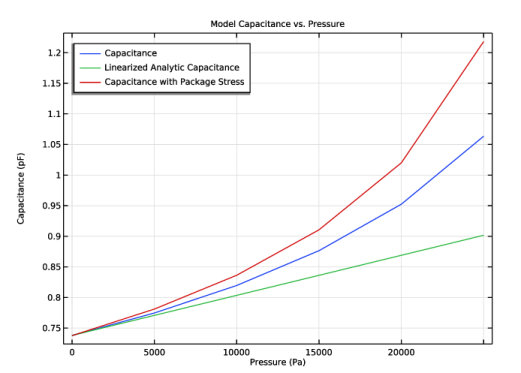
The packaging stress causes a significant change in the response of the device. At zero applied pressure the sensitivity of the COMSOL Multiphysics model has increased to 10×10-6 pF/Pa (40×10-6 pF/Pa for the entire device). Compare to the unstressed value of 7.3e-6 pF/Pa (29×10-6 pF/Pa for the entire device). The effect is even more pronounced at a pressure of 20 kPa, where the model that includes thermal stresses shows a pressure sensitivity of 25×10-6 pF/Pa (100 pF/Pa for the entire device), compared to the unstressed pressure sensitivity of 14×10-6 pF/Pa (sensor output 57 pF/Pa).
It may be possible to calibrate the device to remove the effect of the packaging strains. However, the addition of the thermal stresses to the system has created an additional issue, since the response of the sensor has now become temperature dependent - due to the temperature sensitivity of the thermal strains. This effect is assessed in the final study.